Separating Azeotropic Mixtures
Separating Azeotropic Mixtures. CHEN 4460 – Process Synthesis, Simulation and Optimization Dr. Mario Richard Eden Department of Chemical Engineering Auburn University Lecture No. 6 – Review of Non-ideal Thermodynamics September 27, 2011

Separating Azeotropic Mixtures
E N D
Presentation Transcript
Separating Azeotropic Mixtures CHEN 4460 – Process Synthesis, Simulation and Optimization Dr. Mario Richard EdenDepartment of Chemical EngineeringAuburn University Lecture No. 6 – Review of Non-ideal Thermodynamics September 27, 2011 Contains Material Developed by Dr. Daniel R. Lewin, Technion, Israel
Assess Primitive Problem • Plant-wide Controllability Assessment • Development of Base-case • Detailed Design, Equipment sizing, Cap. Cost Estimation, Profitability Analysis, Optimization Process Design/Retrofit Steps • Detailed Process Synthesis -Algorithmic Methods • PART II
Lecture 6 – Introduction • Separation sequences are complicated by the presence of azeotropes, often involving mixtures of oxygenated organic compounds: • Alcohols • Ketones • Ethers • Acids • Water • In these cases, distillation boundaries limit the product compositions of a column to lie within a bounded region. • This prevents the removal of certain species in high concentrations.
Lecture 6 – Objectives • Be able to sketch the residue curves on a ternary phase diagram • Be able to define the range of possible product compositions using distillation, given the feed composition and the ternary phase diagram
Basics: Ternary Phase Diagrams 0.2 TBA 0.65 DTBP 0.2 DTBP 0.15 H2O
Basics: Ternary Phase Diagrams 0.2 TBA 0.2 DTBP 0.6 H2O
At fixed temperature Homogeneous Azeotropes 1:4 • At equilibrium:
Homogeneous Azeotropes 2:4 • Example – Phase diagrams for benzene-toluene mixture at 90 oC
If the mixture has a minimum-boiling azeotrope • Example – Phase diagrams for Isopropyl ether-Isopropyl alcohol Homogeneous Azeotropes 3:4 For non-ideal mixtures, the activity coefficients are different from unity:
For non-ideal mixtures, the activity coefficients are different from unity: • If the mixture has a maximum-boiling azeotrope • Example – Phase diagrams for Acetone-Chloroform Homogeneous Azeotropes 4:4
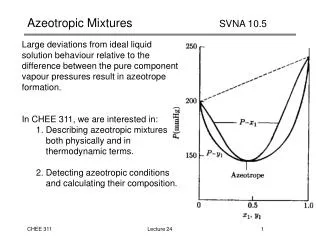
For a minimum-boiling azeotrope with large deviation from Raoult’s law ( ), phase splitting may occur and a minimum-boiling heterogeneous azeotrope forms, having a vapor phase in equilibrium with two liquid phases. Heterogeneous Azeotropes • Homogeneous Azeotrope • Heterogeneous Azeotrope
Rearranging: Residue Curves 1:3 Simple Distillation • Mass balance on species j:
Residue curves for zeotropic system • Residue curves for Azeotropic system Residue Curves 2:3 • Residue Curves Liquid Compositions at Total Reflux
Rectifying section of distillation column Residue Curves 3:3 • Residue Curves Liquid Compositions at Total Reflux • Species balance on top n-1 trays: • Approximation for liquid phase: • Substituting: • At total reflux, D = 0 and Vn = Ln-1
Sketching Residue Curves • Plot pure components on vertices along with Tb • Plot all azeotropes on diagram along with their Tb • Plot residue curves connecting all azeotropes, azeotropes & vertices, and finally vertices & vertices with arrow heads pointing towards increasing boiling point temperatures • Plot additional residue curves that “arch” towards intermediate temperatures on the way to the end point
Pure L distillate Pure H bottoms Product Compositions Regions • For zeotropic systems • L: Lowest boiling component, I: Intermediate boiling component, H: Highest boiling component, F: Feed composition
Product Compositions Regions • For azeotropic systems • Shaded regions: Feasible distillate and bottoms product compositions • Three binary azeotropes and one ternary azeotrope • Two binary azeotropes
Summary – Non-ideal Thermo On completion of this part, you should: • Be able to sketch the residue curves on a ternary phase diagram • Be able to define the range of possible product compositions using distillation, given the feed composition and the ternary phase diagram
Other Business • Homework • SSLW: 8.14b-d, 8.15 • Due Tuesday October 4 • Next Lecture (October 4) • Part 1: Sequencing Azeotropic Distillation Columns (SSLW 230-251) • Part 2: Review for Midterm Exam • Midterm Exam • October 11 during lecture • Open book or closed book? • Lab Session Tonight • I have to take our seminar speaker to dinner, so I am unable to be there. Vivi and Charlotte will be there as usual though.