Download

1 / 19
190 likes | 310 Views
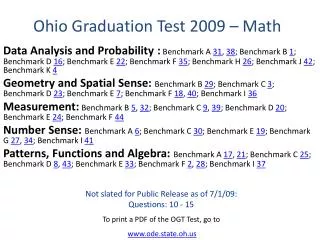
Get Ready. Ohio Graduation Tests March 11 – 15, 2013 for 10 th graders OHVA holds local testing locations throughout Ohio You will receive more information about your testing location. On the OGT :

E N D
Get Ready • Ohio Graduation Tests • March 11 – 15, 2013 • for 10th graders • OHVA holds local testing locations throughout Ohio • You will receive more information about your testing location
On the OGT : • You will be tested in a variety of science areas with emphasis on Physical Science & Biology • You will have many multiple choice and several short answer • You need to answer EVERY question… leave nothing blank!
Want a little more practice before the OGT? • Click on the hyperlink below this announcement or copy the manual address into your browser • Then click on Take a Test without Logging In • Choose the subject you would like • Several practice tests are available for each subject Click Here Manual Site Address: http://ogt.success-ode-state-oh-us.info/Profile/Login.aspx?ReturnUrl=%2fpracticetest%2ftestworkbook.aspx%3fnav%3dstudent&nav=student
OGT Science Performance Verbs Why do I need to know these verbs? • Commonly found in short answer and extended response questions. • The exact instructions for what you are supposed to do will usually be a “performance verb”. • The performance verbs ask you to present information in a certain way.
How to Answer Extended Response and Short Questions Activity #3
How many, what kind? • 4 Short Answer • 2 from Life, Earth/Space, or Physical Sciences • 2 from Nature of Science & Technology • 2 Extended Response • 1 from Life, Earth/Space, or Physical Sciences • 1 from Nature of Science & Technology
Steps to Answering Short Answer and Extended Response • Analyze and Plan • Look carefully at directions • Underline exact instructions • Jot down ideas • Write Your Answer • “Echo” the question • Answer exact instructions • Write paragraphs or lists • Review & Revise • Did I complete all parts in the question? • Did I provide enough details, examples, and reasons to support my answers?
Example Extended Response Question QUESTION: Identify two important scientific theories and provide one example of evidence supporting each theory.
Example Extended Response Question QUESTION: Identify two important scientific theories and provide one example of evidence supporting each theory. • How does this break down as points? • List one theory • List another theory • Provide example of evidence for theory #1 • Provide example of evidence for theory #2
Scoring Guidelines 4 Points – The student identifies two important scientific theories and provides one example of evidence supporting each theory. 3 points – The student identifies two important scientific theories and provides an example of evidence supporting one theory. 2 points – The students identifies two major scientific theories but fails to or incorrectly provides evidence supporting each theory. - OR - The student identifies one major theory and provides an example of evidence supporting this theory. 1 point – The student identifies one major theory. 0 points – The student response does not meet the criteria to earn one point. The response indicates inadequate or no understanding of the task. It may only repeat information from the prompt or provide incorrect or irrelevant information. The student may have written on another topic or written, “I Don’t Know”
Example 4 point answer • Scientists often develop theories to explain what they observe. Two important scientific theories are the atomic theory and the germ theory of disease. Atomic theory states that all matter is composed of tiny particles called atoms. Atomic theory is supproted by experiments in which scientists aimed radiation at atoms to discover their parts. The germ theory of disease states that many diseases are caused by microscopic organisms in the air. This theory was supported by the fact that the same organism can always be seen under a microscope when a person is affected by a particular disease.
Example 2 point answer • Two important scientific theories are plate tectonics and the “Big Bang” theory.
Example 1 point answer • Newton’s Theory of Gravity – all things fall. • Cell Theory – all living things are made of cells.
Example 0 point answer • The “Big Bang” theory is supported by evidence from many different scientists that proves that cells create a big bang when they hit into one another. • Uhhh…..NO!!!
Temperature Experiment Students pour 250.0 g of water into an open insulated container. The initial temperature of the water inside the container is recorded. The temperature of the contents of the container is recorded every 3.0 minutes. When 73.0 g of ice (at melting point) is added to the container, the students continue to collect temperature data and the mixture is gently stirred. The data from Experiment 1 are listed in the chart below. The data are also plotted on the following graph. In a proposed experiment using twice as much ice and half as much water as in Experiment 1, a student predicts the values shown in the graph below. Compare the shapes of the graphed lines from Experiment 1 and the proposed experiment and explain why the predicted values are probable. (2pt short answer question)
In a proposed experiment using twice as much ice (146 g) and half as much water (125.0 g) as in Experiment 1, a student predicts the values shown in the graph below. Compare the shapes of the graphed lines from Experiment 1 and the proposed experiment and explain why the predicted values are probable. Check your answer: 2pts = If you correctly compared the shapes of each graph AND explained why the predicted values are probable. 1pt = If you did only compared the graphs OR explained why predicted values are probable. 0pt = IDK
In a proposed experiment using twice as much ice (146 g) and half as much water (125.0 g) as in Experiment 1, a student predicts the values shown in the graph below. Compare the shapes of the graphed lines from Experiment 1 and the proposed experiment and explain why the predicted values are probable. ANSWER SAMPLES 2pts The graph is the same basic shape between the proposed graph as it is in the experiment 1 graph. Both follow relatively the same curve, with the proposed curve being a little deeper. This makes sense because there is more ice, so the water should cool faster, but the data will show the same trend. 1pt The predicted values are probable because the temperature lowered quicker. OR The temperature in the proposed experiment went down faster than in the first experiment. 0pt The results are probable because each graph has the same shape, began at the same time, and show the same temperature.
Remember…. • Read the question carefully • Answer all parts of the question • Use correct scientific information • Include vocabulary to help answer the questions