1 / 3

SVR (%)

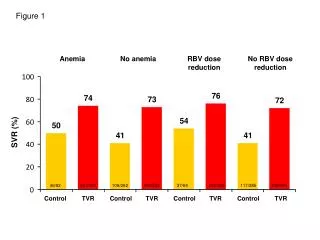
Figure 1. Anemia. No anemia. RBV dose reduction. No RBV dose reduction. 100. 76. 74. 80. 73. 72. 54. 60. 50. SVR (%). 41. 41. 40. 20.

kamala
Download Presentation

SVR (%)

An Image/Link below is provided (as is) to download presentation Download Policy: Content on the Website is provided to you AS IS for your information and personal use and may not be sold / licensed / shared on other websites without getting consent from its author. Content is provided to you AS IS for your information and personal use only. Download presentation by click this link. While downloading, if for some reason you are not able to download a presentation, the publisher may have deleted the file from their server. During download, if you can't get a presentation, the file might be deleted by the publisher.

E N D

Presentation Transcript


  1. Figure 1 Anemia No anemia RBV dose reduction No RBV dose reduction 100 76 74 80 73 72 54 60 50 SVR (%) 41 41 40 20 46/92 267/361 108/262 384/524 37/69 242/320 117/285 408/565 0 Control TVR Control TVR Control TVR Control TVR

  2. Figure 2 No anemia Anemia 100 78 74 80 71 68 58 60 SVR (%) 40 20 212/363 95/129 29/37 109/153 30/44 0 No anemia EPO use alone RBV reduction alone Both Neither

  3. 9% Front 18% Back 18% 9% 9% 18% 18% Figure 3

More Related