Download
1 / 77
770 likes | 990 Views
Re-Design of a Pre-Admission Facility. Interactive Quality Improvement Workshop. Richard Bowry, MD Antoine Pronovost, MD Patricia Houston, MD. Outline. Introduction to DMAIC methodology Case study stem 1 Key concepts and facilitated discussion stem 2 Process mapping exercise

E N D
Re-Design of a Pre-Admission Facility Interactive Quality Improvement Workshop Richard Bowry, MD Antoine Pronovost, MD Patricia Houston, MD
Outline • Introduction to DMAIC methodology • Case study stem 1 • Key concepts and facilitated discussion • stem 2 • Process mapping exercise • Quantitative analysis, facilitated discussion • Quantitative analysis, group work • stem 3 • Root cause analysis didactic session • Facilitated discussion: leading change… “what went wrong” • stem 4 • Didactic session: key success factors for implementing and monitoring change • Conclusion
Disclosures • Dr Richard Bowry • No disclosure • Dr. Patricia Houston • No disclosure • Dr Antoine Pronovost • Has received funding from the government of Ontario to study and improve Pre-admission facility processes.
Objectives • You will understand how to apply Quality Improvement techniques to the complex problem of redesigning a PAF • You will become familiar with the five stages of DMAIC • You will become familiar with the key principles of successful change management
Limitations and Caveats • We will not be providing you with a “cook-book” answer for fixing problems in your own PAF • Solutions take teamwork, planning and local insights to work • The case study is loosely based on actual experience, but has been heavily adapted for the purpose of this session
DMAIC - Define • Reasons for action? • What are our targets? • What is within our control? • All members need to agree on the problem • Create a purpose statement – rationale, scope and targets • Start an A3 style grid to monitor progress
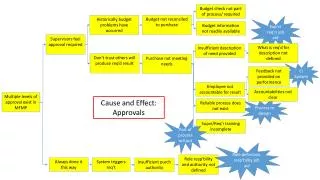
DMAIC - Measure • What is our baseline? • Acknowledge our own variation / trends? • What happens 80% of the time? • Root cause analysis • Prioritization matrix • Cause Effect Diagram
DMAIC - Analyze • What does our current state look like? • Are there any wasted steps in what we do? • How would a patient experience this? • What are the root causes? • Process mapping to identify NVA steps • Holistic approach looking at all aspects • Spaghetti Charts
DMAIC - Improve • How should the future state look? • Use rapid process improvement cycles • Pilot and observe • Remove unnecessary steps and create a future state • No need to get it perfect first time • Implement pilots to assess impact
DMAIC - Control • Re-evaluate and make ongoing changes • Monitor the new performance • Repeat the cycle as require to further improve • Reevaluate the changes and re-design as needed • Repeat evaluation of process to assess impact • Ongoing performance monitoring
Case Study Stem 1 • You have been asked to review your preadmission facility by your CMO because: • Patients are unsatisfied with long wait times • Surgeons offices are frustrated they cannot access short-notice appointments • These are necessary to fill time released by last-minute patient cancellations • Staff complain of declining morale • Anaesthesiologists are reluctant to work in clinic
2. Facilitated discussion: Key concepts and tools to address this problem • Perception shift: this is a chain, not a series of independent events • Concepts: • Bottleneck • Batching • Flow mapping: practicalities
This is a process, not a series of independent events Anne M Breen, Tracey Burton-Houle, David C Aron,Applying the theory of constraints in health care: Part 1-- the philosophy, Quality Management in Health Care; Spring 2002; 10, 3;pg 40.
If each step has a measurable capacity, what determines overall throughput? Average (13) Highest cacapacity pacity (17) Lowest capacity (8) Cannot answer – need simulation model
The chain must be considered as a whole, not as a series of independent events Local optima don’t matter ! 20
Because in real life, systems need flexibility: Ability to catch up = excess capacity Need for excess capacity increases with system complexity/variability If bottlenecks limit throughput, why not simply eliminate them? 13 13 13 13 13
Identify the bottleneck Elevate the bottleneck Design the process around the bottleneck Unload the bottleneck Keep the bottleneck busy all the time This means non-bottleneck resources MUST sometimes be IDLE. So what do you do with bottlenecks?
Batching: a very special effect on bottlenecks • Batching refers to the processing of many units in a single group, for example: • I change all the ceiling light bulbs at the same time because I need a stepladder (hard to get) • Painting all similar colours together (trim, then walls, then contrast wall) • Porters delivering multiple samples to the lab
Batching: advantages and disadvantages Feast Famine Locally optimized, globally broken
What if I don’t get it right the first time? How do I keep people focused? How do I frame the hypothesis? How much technical stuff do I need to know to participate or lead this discussion? Flow Mapping: Common Concerns
Don’t worry… you won’t get it right the first time – That’s part of the plan… It’s an iterative process, and you’ll likely need a few drafts. It’s a group process, and much benefit comes from team discussion: “Oh so that’s what happens when the patient leaves my care…” What if I don’t get it right the first time?
Set clear ‘start’ and ‘end’ points Follow a single patient through a standard encounter Use Post-It notes on large paper background Transcribe draft into clean computer after meeting Basic approach to frame the process
3. Process Mapping exercise • Please use this time to develop a process map in small group settings • Use the data from case study stem 2 (next slide) as a starting point for your process map
Case study stem 2: Clinic details • 60 patients are seen daily; • Patients are registered, then seen by a nurse, then by a family doctor; • 50 % of patients seen by an anaesthesiologist; • Subgroups (orthopaedic and cardiac surgery) patients also receive group teaching; • Other patients receive DVD-based teaching; • Most patients receive bloodwork, and EKG +/- xray investigations while in clinic.
Define – Process Mapping Exercise • Three groups • Map the current state • Brief Presentation of processes found
Initial Thoughts • Quick Fix approach vs Root Cause Analysis • Bottlenecks • Local optima vs global optimum • Non-value add activity • Batching
Define – Process Mapping Exercise • Lessons Learned • Conventions in mapping • Importance to map out whole process
Measure • Sources of Data • IT/IM Resource • Presentation of information
5. Quantitative analysis Group workCase Study Stem #3 • Quantitative Data to be provided in the following slides/handouts. Please review and discuss implications of quantitative data.
Stem #3: Quantitative Data (Continuation) • Re-Design of a • Pre-Admission Facility
Stem #3: Quantitative Data (Continuation)AN wait time by scheduled time of day
Measure – Data Interpretation • Wait-time and value-add times • Satisfaction • Capacity analysis • Scheduling • Variability
Analyze – Theory of Constraints 1. Identify the Constraint 2. Exploit the Constraint 3. Subordinate everything to the Constraint 4. Elevate the Constraint 5. Repeat for the new Constraint
7. Facilitated discussionCase Study Stem #4: Le denouement • Suggestions are implemented, but results are not anticipated • Wait times increase • Throughput decreases • Morale deteriorates significantly • Staff, especially RN’s leave their positions leaving unfilled vacancies • Much finger-pointing/blaming ensues
8. Key success factors for implementing and monitoring change