Download
1 / 58
630 likes | 1.03k Views
Forage Quality for Profitable Milk Production . Jim Linn, Professor Emeritus Univ. of Minnesota. Lactation Ration Ingredients. % OF DM. FIBER Physical & Chemical Protein, Energy, Carbohydrates, Minerals,. FORAGES. 50. Flexible Ration Feeds. 20. FORAGE, GRAIN OR BYPRODUCTS.

E N D
Forage Quality for Profitable Milk Production Jim Linn, Professor Emeritus Univ. of Minnesota
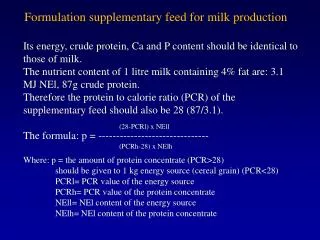
Lactation Ration Ingredients % OF DM FIBER Physical & Chemical Protein, Energy, Carbohydrates, Minerals, FORAGES 50 Flexible Ration Feeds 20 FORAGE, GRAIN OR BYPRODUCTS Nutrient needs and $ Non-Fiber CHO Starch Protein RDP & RUP Minerals • CONCENTRATES • CORN • PROTEIN • MINERALS/ADDITIVES 30
Feed Cost (% of total) for 85 lbmilk_ Fat 4-7% Feed Cost/Cow/Day $8.00 - $10.00 Feed Additives 2 – 5% Min-Vit 4 – 8% RD-Protein 5 – 8% RU-Protein 20 – 25% Byproducts 10% Grain – Starch 15 – 20% Forages 45 – 50%
Should You Maximize Forage Feeding? Alfalfa/Grass Forage $250 to $300/ton hay basis Corn Silage – 35% DM $55 - 85/ton – 40% starch $50 – 70/ton – 30% starch
Forage Quality Measurements Chemical Physical peNDF PN State Particle Separator (PSPS) • Dry matter (DM) • Ash • Crude Protein • True, Non Amm N, Sol • NDF • Lignin • NFC (NSC) • Starch • Sugar • Pectin Digestibility • NDFD • Starch
Practical Application of Forage Quality Variation On Farms Cows require Nutrients
Forage DM ConsistencyMcBeth et al. Ohio State U Con = 55%F:45%C UNB = same diet with 10% water added to forage BAL = diet adjusted for decrease in forage DM
McBeth et al., 2012 Ohio State University
Monitoring Forage DM on Farms • Determine Forage DM - 2X/week • Adjust ration 3 unit change in DM • Establish protocol
Fiber Requirements for Lactating Dairy Cows Good, Bad and Unknown Chemical Physical
ISSUE - MIXED COMPOSITION OF NFC Corn Silage NDF – 42% CP – 8% Fat – 3% Ash – 6 % NFC = 41% Alfalfa NDF – 36% CP – 22% Fat – 3% Ash – 11% NFC = 28%
Effect of Forage Fiber on Milk Production Eastridge, OSU
Dairy cow performance and NDF Digestibility • As NDFD increases 1% unit: • .4 lb DMI • .55 lb FCM • MSU, Oba and Allen
U of MN Study Alfalfa Hay Dig NDF Importance of forage quality • NDF concentration • NDF digestibility (NDFD) Previous studies • Confounding NDF digestibility and NDF concentration Interest surrounding NDFD • TDN equation • (NRC, 2001) • RFQ
Treatment NDF In vitro 48-h Designations concentration NDF digestibility LH Low High LL Low Low HH High High HL High Low • Determine the effect of alfalfa hay fiber digestibility, compared within relatively high and low NDF concentration hays Alfalfa Hay Treatments
Treatment LH LL HH HL DM, % 93.8 93.0 87.4 91.5 NDF, % 37.2 36.4 41.7 40.8 IVNDFD1, % NDF 41.3 37.9 44.6 41.1 CP, % 21.4 22.5 20.1 20.8 NFC, % 28.8 24.0 24.0 25.9 RFV 163.1 168.7 138.2 143.4 RFQ 156.0 144.9 143.0 138.1 Hay Lot Core Samples2 cores per bale 148-hour in vitro NDF digestibility
Treatment LH LL HH HL --------- % of diet (DM basis) --------- Hay116.0 16.0 13.7 13.7 Corn silage 36.3 36.3 33.7 33.7 Corn 13.1 13.1 17.8 17.8 Grain Mix2 26.4 26.4 26.5 26.5 Roasted Soybeans 5.2 5.2 5.3 5.3 Molasses 3.0 3.0 3.1 3.1 MN - 15% of diet DM Diet Ingredient Composition 125% of LL hay fed as long-stem 2Grain mix composition (air dry basis) = 34.3 % soybean meal, 22.9% DDGS, 3.8% blood meal, 26.7% soybean hulls, 12.3% vitamins/minerals
Treatment LH LL HH HL ---------------------------- % of DM ------------------------- DM 59.8 60.1 61.3 60.5 CP 17.5 17.9 18.0 17.6 NDF 31.4 30.9 30.0 29.9 Forage NDF 21.6 21.0 19.7 19.6 EE 3.3 3.4 3.5 3.4 NFC 41.4 41.2 42.9 43.0 NEL3X(Mcal/kg) 1.6 1.6 1.6 1.6 MN - 15% of diet DM Nutrient Composition of Diet1 1Analysis conducted on individual diet ingredients
Materials and Methods Hays • Ground using AgriMetal tub grinder • LL treatment received 25% of hay as long stem Diets • Fed as TMR (Data Ranger)
Hay Characterization-MN LH HH LL HL
Treatment LH LL HH HLTrt N =15 16 12 12 --- p-value--- DMI,kg/d 22.8 21.7 22.1 22.8 .77 Milk,kg/d 38.8 38.8 39.3 39.3 .99 3.5% FCM, kg/d38.3 40.0 40.5 40.4 .59 FE,kg 3.5% FCM/kg DMI1.7 1.9 1.9 1.9 .53 BW change1,kg -20.8 -49.1 -37.8 -24.5 .29 MN - 15% of diet DM Production Performance and Body Weight (BW) Change 1BW change = initial - final body weight
Part II.US Dairy Forage Research CenterAlfalfa Hay = 30% of Diet DM
Treatment LH LL HH HL ---------------------------- % of DM ------------------------- DM 59.8 59.8 59.3 59.6 CP 17.4 17.4 18.7 18.1 NDF 28.6 28.0 28.7 28.6 Starch 24.6 24.5 24.4 24.5 WI - 30% of diet DM Nutrient Composition of Diet1 1Analysis conducted on individual diet ingredients
Treatment LH LL HH HLTrt --- p-value--- Milk yield, kg 43.9 45.2 46.545.3 <.18 Fat, % 3.43.53.43.4<.75 WI - 30% of diet DM Milk Yield and Fat %
Potential Reasons for Lack of Response to Treatment Small difference in NDF and in-vitro 48-h NDFD • NDF (4.5 % units) • NDFD (3.5 % units) Physical Characteristics of hay • Particle size post grinding
Corn Silage – NDFD Stover= ~55-60% of WPDM Leaves = 15% of DM Stem = 20-25% of DM Cob + Shank + Husk = 20% of DM • Grain ~ 40-45% of WPDM • Avg. 28% starch in WPDM • Variable grain: stover • 80 to 98% starch digestibility • Kernel maturity • Kernel particle size • Endosperm properties • 40 to 70% NDFD Laurer, UWEX
Effects of increasing Corn Silage ndfd on 3.5% FCMCorn silage – 45% of ration DM P=0.70 Silage 0% BMR 100% BMR 24 hr IVNDF, % 36 41 48 hr IVNDF,% 54 62 NDF, % 45 44 U of MN
Fiber Requirements for Lactating Dairy Cows Physical Particle size
Function Stimulates rumination Builds fiber mat in rumen Helps prevent acidosis and low milk fat tests FIBER – Physical or Effective
Hay Characterization-MN LH HH LL HL
Hay Characterization- MN Particle Size of Ground Hays Monthly Analysis Using Penn State Forage Particle Separator LH Upper, % = 26.9a Middle, % = 16.6a Lower, % = 33.3 Bottom, % = 23.2a HH Upper, % = 14.6b Middle, % = 23.1b Lower, % = 32.8 Bottom, % = 29.5bc LL Upper, % = 9.7b Middle, % = 22.8b Lower, % = 34.0 Bottom, % = 33.4b HL Upper, % = 23.5a Middle, % = 21.5b Lower, % = 30.2 Bottom, % = 24.8ac
Recommended Percent of Feed Particles Penn State Particle Size Box
Particle Size Feed and Feed Refusals50 free stall herds – MN 2nd screen >8 mm 3rd screen >1.18 mm Top screen >19 mm Pan <1.18 mm Fed 3 hr 6hr 9hr 24hr Endres et al. 2010 JDS
Shredlage Study – Univ of Wisconsin –Shaver et al. Shredlage KP Photos provided by Kevin Shinners, UW Madison, BSE
Penn State Separator Box (as-fed basis) Samples obtained during feed-out from the silo bags
Penn State Separator Box (as-fed basis) TMR Samples
Feed Sorting – PSU Separator Box % of Predicted Intake
3.5% FCM Yield by Week * * P < 0.10 ** ** P < 0.01 * Week × Treatment Interaction (P < 0.03) U. of WI – Shaver et al
Alfalfa Orchardgrass --------------- % DM-------------- NDF 40.8 59.7 ADF 31.3 32.7 CP 21.7 16.4 NDICP 3.49 7.04 Lignin 4.66 2.36 Ca 1.86 0.43 K 2.42 3.19 Hay Nutrient Composition1 1Analysis conducted on weekly grab samples of chopped hays.
Digestion Kinetics of Hays1 IVNDFD Alfalfa Rate = 5.20% per hr Potential = 55.5% Orchardgrass Rate = 4.60% per hr Potential = 78.7% 70.8% 52.0% 1Incubation time points = 6, 12, 18, 24, 32, 48, 72 and 96 hr.
Ingredient Composition of Alfalfa Diets Alfalfa Hay, % of Diet DM 15 20 25 30 35 Corn silage35.0 35.0 35.0 35.0 35.0 Alfalfa hay1 15.0 20.0 25.0 30.0 35.0 Corn, ground 20.6 17.7 15.0 11.8 7.60 Soybean meal, 44% 6.68 4.74 2.78 0.88 0.00 Protein/mineral mix2 18.0 18.0 18.0 18.0 18.0 Molasses mix 4.00 4.00 4.00 4.00 4.00 Calcium carbonate 0.56 0.34 0.00 0.00 0.00 Monocalcium phosphate 0.16 0.20 0.24 0.30 0.40 1Alfalfa hay ground using a vertical mixer prior to feeding. 2Protein/mineral mix composition (air dry basis) = 30.0% soybean hulls, 30% soypass, 18.4% corn distillers grains, 5.0% bloodmeal, 7.5% energy booster, and 8.9% minerals/additives.
Ingredient Composition of Orchardgrass Diets Orchardgrass Hay, % of Diet DM 10 15 20 25 30 Corn silage35.0 35.0 35.0 35.0 35.0 Orchardgrass hay1 10.0 15.0 20.0 25.0 30.0 Corn, ground 21.5 17.7 13.8 10.1 6.06 Soybean meal, 44% 10.3 9.24 8.18 7.06 6.00 Protein/mineral mix2 18.0 18.0 18.0 18.0 18.0 Molasses mix 4.00 4.00 4.00 4.00 4.00 Calcium carbonate 1.14 1.10 1.06 0.84 0.94 1Alfalfa hay ground using a vertical mixer prior to feeding. 2Protein/mineral mix composition (air dry basis) = 30.0% soybean hulls, 30% soypass, 18.4% corn distillers grains, 5.0% bloodmeal, 7.5% energy booster, and 8.9% minerals/additives.
Alfalfa Orchardgrass -----% Particle Retained (as-is) ----- Top 16.7a 28.5x Second 27.8b 30.0x Third 28.6b 28.6x Bottom 26.9b 13.1y Physical Characteristics of Hays1 1Analysis conducted on weekly grab samples of chopped hays using the Penn State Particle Separator. Statistical analysis conducted within forage species.