Download

1 / 7
80 likes | 177 Views
Learn about the Rapidly Developing Thunderstorms (RDT) product developed by Nowcasting Satellite Application Facility (SAF), enabling the identification, monitoring, and tracking of intense convective clouds. RDT utilizes geostationary satellite data for real-time information on convective systems from meso to smaller scales. The process involves detection, tracking, and discrimination stages, using infrared imagery and convective masks from numerical weather prediction models. Statistical methods and empirical rules aid in distinguishing convective and non-convective cells. Visualizations include contour thickness and color schemes for different stages of convective cell development.

E N D
RDT – Rapidly Developing Thunderstorms • Satellite Application Facilities (SAFs) are dedicated centres for processing satellite data, achieved by utilizing specialist expertise from the European Union Member States. • The Agreement of Co-operation of a Satellite Application Facility supporting Nowcasting and Very Short-Range Forecasting (VSRF) was signed by EUMETSAT and the Spanish Met Service (INM) in December 1996. • The project started in February 1997 aiming to produce the software to deal with the Nowcasting and Very Short Range Forecasting using the characteristics of the MSG SEVIRI data and the NOAA and EPS AVHRR data (EUMETSAT Satellites).
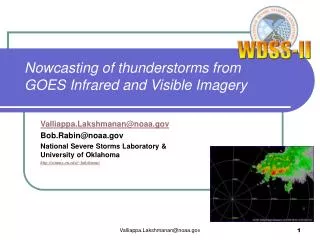
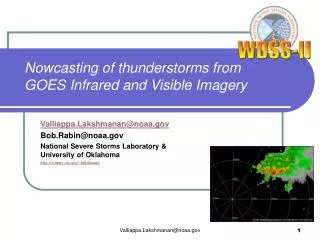
Amongst the list of products developed by the Nowcasting SAF (NWC SAF) is a so-called “Rapidly Developing Thunderstorms” product. • It is using mainly geostationary (MSG) satellite data but also NWP and provides information on significant convective systems, from meso-scale (200 to 2000 km) down to smaller scales (< 1 km).
The objectives of RDT are twofold: • The identification, monitoring and tracking of intense convective system clouds • The detection of rapidly developing convective cells, • There are 3 stages in the process: • Detection • Tracking • Discrimination
A. Detection • Detection phase of RDT involves defining cells in IR10.8 imagery • Different features identified through comparison of Brightness Temperature (BT) values defined by adjustable thresholds
B. Tracking • Tracking phase is conducted using sequence of IR10.8 images • RDT identifies overlapping of cells in two consecutive images • RDT then tracks the detected cloud systems and calculates the direction of motion of the storm cells
C. Discrimination • Convective mask (from NWP) identifies stable, neutral/unclear and unstable areas to remove stable regions from being processed, thus reducing processing time and reducing false alarms • Statistical methods to discriminate between convective and non-convective cells • Empirical rules are used to declassify objects with MSG and NWP data for pre-tuning
Visualisation • Contour Thickness • Thin: low cooling rate • Mean: medium cooling rate • Thick: strong cooling rate • Color • Green: location of past object • Yellow: first detection • Orange: first detection (split) • Red: growing • Violet: mature • Blue: decreasing • Arrow: advection at 30 mn • Yellow line: trajectory