
Uploaded by
kaleb
14 SLIDES
312 VIEWS
140LIKES
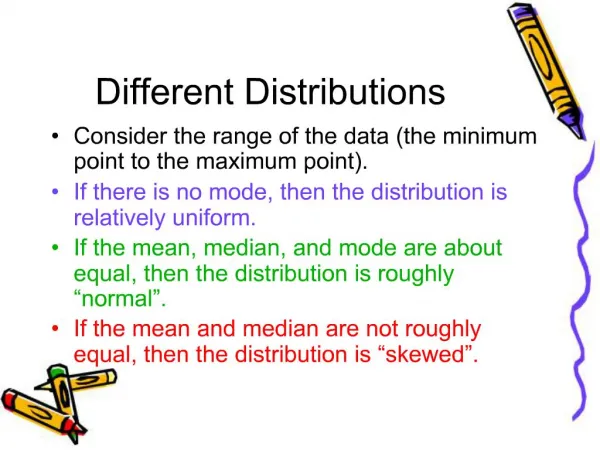
Different Distributions
DESCRIPTION
Advantages/Disadvantages of Displays. Categorical data: pictograph, bar graph, circle graphNumerical data (one variable): line plot, histogram, stem and leaf plot, box and whisker plotTwo categorical variables: double bar graphTwo of same numerical variables: side-by-side stem and leaf plot,
Download
1 / 14
Download Presentation 
Different Distributions
An Image/Link below is provided (as is) to download presentation
Download Policy: Content on the Website is provided to you AS IS for your information and personal use and may not be sold / licensed / shared on other websites without getting consent from its author.
Content is provided to you AS IS for your information and personal use only.
Download presentation by click this link.
While downloading, if for some reason you are not able to download a presentation, the publisher may have deleted the file from their server.
During download, if you can't get a presentation, the file might be deleted by the publisher.
E N D
Presentation Transcript


More Related