Download
1 / 67
680 likes | 1k Views
MPAC Presentation to BIA 2007 National Conference. April 3, 2007. Presentation by Bill Bradley, B.A., AACI,P.App. Account Manager, Business Relations Municipal Property Assessment Corporation. Presentation Topics. MPAC Roles, Responsibilities and Relationships 2007 Ontario Budget Update

E N D
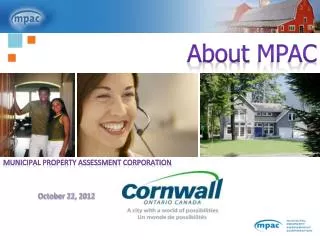
MPAC Presentation to BIA 2007 National Conference April 3, 2007 Presentation by Bill Bradley, B.A., AACI,P.App. Account Manager, Business Relations Municipal Property Assessment Corporation
Presentation Topics • MPAC Roles, Responsibilities and Relationships • 2007 Ontario Budget Update • Approaches to Value • Storefront Retail Valuation: Approaches to Value • Overview of CAMA for Storefront Retail • Valuation Process: Office and Shopping Centre • Capping and Clawback Example • Questions & Answers
Assessment Review Board MPAC Roles, Responsibilities and Relationships Legislate Administer Adjudicate Tax Municipalities & Province
MPAC: Roles and Responsibilities cont’d • Assign a Current Value Estimate (CVA) & property tax class to 4.5 million properties on an annual basis • Annual Assessment Rolls to all 445 municipalities • Prepare provincial jury lists, school support lists and municipal voters’ lists
MPAC: Roles and Responsibilities • MPAC assigns CVA as well as property tax class in accordance with O. Reg 292/98 • Classification of property based on use • Seven major property classes • Residential, multi-residential, commercial, industrial, pipeline, farm, managed forests • Property tax class also determines Municipal tax rate to apply • Province of Ontario sets the education tax rates
Ontario Budget 2007: Assessment Related Changes • Assessment Cycle changes to four years • Four year cycle commences for taxation commencing Jan. 1 2009 based on Jan. 1 2008 assessed value • Next assessment update will be based on Jan.1 2012 valuation date for taxation beginning Jan. 1 2013
Ontario Budget 2007: Assessment Related Changes (cont’d) • MPAC will phase in assessment increases for residential, farm and managed forest properties over four year cycle: • Example: Assume property increased in value by 20% from Jan 1 2005 to Jan 1 2008 • Means 5% increase in assessment over the next 4 years (2009,2010, 2011, 2012)
Ontario Budget 2007: Assessment Related Changes (cont’d) • Assessment decreases are immediate • Province will consult with stakeholders to determine if phase in will be expanded to other property classes (commercial, industrial, multi-residential)
Ontario Budget 2007: Assessment Related Changes (cont’d) • Request for Reconsideration (RfR) is mandatory first step of an assessment appeal • Assessment Review Board (ARB) deadline to coincide with completion of RfR process • Standard information disclosure requirements for RfR and appeal stages • These changes targeted for 2008 assessed values for 2009 taxation
Ontario Budget 2007: Assessment Related Changes (cont’d) • Business education taxes will be reduced by $540 million over the next seven years • Target rate for commercial and industrial properties will be 1.60 ( currently Toronto education tax rate is 1.97 commercial)
Assessment Update Information • All properties in Ontario are currently valued on a January 1, 2005 valuation date • Next province-wide reassessment will be based on a January 1, 2008 valuation date • Commercial, Industrial and Multi-Residential properties are “capped” classes of property
What is to be valued? • According to the Assessment Act all real property in Ontario is to be assessed at its current value (CVA) • What is the definition of CVA: • “Current Value means in relation to land, the amount of money the fee simple, if unencumbered, would realize if sold at arm’s length by a willing seller to a willing buyer.”
Approaches to Value • To estimate Current Value the appraiser can use any one or more of the three approaches to value: • Direct Comparison Approach (Comparative Sales) • Cost Approach • Income Approach
Approaches to Value (cont’d) • Direct Comparison Approach • Models the behavior of buyers and sellers in the real estate market • Compares property to be valued with recently sold properties • Works best when there are sufficient comparable sales • Sales Comparison approached used to value s.f.d., all condominiums, res. waterfront, vacant land, retail strip stores in some areas
Approaches to Value (cont’d) • Cost Approach • Seeks to determine the replacement cost of the improvement less depreciation plus the land value • Primary approach on properties that do not regularly trade in marketplace • Land estimate from vacant land sales and land residual methods • Market modified cost approach • Assessment to sale used as a test
Income Approach to Value • Based on the principle that the value of an investment property is reflected in the income it is anticipated to generate over its life • Such properties are generally purchased for the right to receive the future income flow • Present worth of the income stream plus the present worth of the reversion
Property Types Valued by the Income Approach • Office Buildings, Shopping Centres • Multi residential – Rows & Apartment Buildings • Hotels, motels • Nursing homes, Retirement homes • Golf courses • Multi-use properties • Specialty properties I.e. Air Canada Center, Corel Center, CN Tower, Rogers Center.
Storefront Retail: Approaches to Value • If sufficient sales MPAC employs the Sales Comparison Approach • Retail Storefront in Toronto, Ottawa • If insufficient sales MPAC employs a Market Adjusted Cost Approach • Retail Storefront in Eastern and Northern Ontario • Fast Food chains, retail gas stations (vacant land sales) • Built-on sales are scarce • MPAC utilizes Handscombe cost data base as well as cost questionnaires collected from owners
CAMA for Retail Strip: Toronto and Ottawa • MPAC uses MRA (Multiple Regression Analysis) as a tool to assist in the determination of the initial values (before fine tuning) for the Toronto and Ottawa Retail Strip stores • Reasonable sample of arms length sales in each economic neighborhood • Physical and locational variables collected on all strip properties • MPAC builds a computer model based on all the open market sales and associated physical and locational data for the strip store properties
Overview of Computer Assisted Mass Appraisal for Storefront Retail
Single Property Versus Mass Appraisal • Single property appraisal is the appraisal of one property at a time • Mass appraisal is the process of valuing a group of properties as of a given date, using standardized methods and allowing for statistical testing • Multiple Regression Analysis (MRA) is an appraisal application of the sales comparison approach
Sample MRA Value Calculation: Storefront Retail • Sample subject property has the following attributes: • Located in the area referred to the “ Danforth East “ • Lot frontage 20 feet; lot depth 120 feet • 2 story strip store with full basement built in 1965 • Ground floor 2,000 s.f.; 2nd floor 1,000 s.f. • Finished basement area of 500 square feet • metered street parking • 1-2 bedroom apartment on 2nd floor • Property located on a corner
20feet @ $10,000 pff East End of Any Municipality - 120’ What makes up the value? Base Value = $30,000 $200,000
Age of Structure May, 1965 = - $ (40,000) Finished Bsmt 500 s.f. @ $12/sq.ft. = $6,000 Structure 2nd Floor 1000 s.f. @ $45/sq.ft. =$45,000 Main Floor 2000 s.f. @ $60/sq.f. =$120,000 2 D Bsmt 2000 s.f. @ $10/sq.ft. = $20,000
LOCATION + SITE Corner + $50,000 STRUCTURE $ 431,000
Parking Code • This variable indicates the existence of parking on the property or in the immediate vicinity of the property • F = Free On Site • P = Meter On Site • S = Free On Street • M = Meter On Street • N = No Parking
Corner • This is a variable designed to record whether the property is on a corner lot i.e.. Exposure on two streets • 0 = Not on a Corner • 1 = On a Corner
Boulevard • This is a variable to record the existence of a boulevard in front of the property. It identifies properties that have a divided traffic flow • 0 = No • 1 = Yes
One-Way Street • This variable identifies if the property is on a one way street • 0 = No • 1 = Yes
Street Exposure • This variable indicates the “Primary Exposure” of the front of the property (the direction the storefront faces) • N = North • S = South • E = East • W = West
Street Code • This variable indicates the “Traffic Pattern” • E = Extremely Heavy (highways) • H = Heavy (arterial) • M = Medium (collector) • L = Light (local)
Rear Access • This variable indicates the availability of rear access to the property • L = Laneway • D = Driveway • O = Other Street • N = None
Storeys and Building Areas • Number of floor levels of the structure • This variable is numeric 1, 2, 3…. • Building areas are recorded by floor (ground, 2nd, 3rd, basement, finished basement etc.)
Renovated Commercial Unit • This variable indicates if the property has been renovated in the last 5 years
Street Access to Basement • Basement accessible from street • 1 = Yes • 0 = No
Storefront Retail: Data Collection • Site data: frontage, lot depth, lot area, rear access, parking availability, on-site parking, off-site parking, corner, orientation (N/S/E/W), one-way street, boulevard • Structure data: • building areas (ground, 2nd, 3rd , basement) • Year built, renovations • Type of construction • Economic • Homogeneous Neighbourhood
Sales Analysis • MPAC will verify with properties owners the details surrounding the sale • Is the sale open market, arms-length transaction? • What were the particulars of the sale? • MPAC valuation staff will conduct these sales interviews • Inspect the sales properties to determine data at time of sale (additions, renovations demolitions etc.)
Market Adjusted Cost Approach Analysis • Step 1: Establish Land Value • Vacant land sales or land residuals • Step 2: Estimate Replacement Cost New for Buildings • MPAC uses current market cost data base (Handscombe) • Building values adjusted by deducting depreciation from all sources
Market Adjusted Cost Approach Analysis (cont’d) • Step 3: • Summation of Land and Building estimates • Step 4: Test Value Estimates Using Sales • Assessment to Sale Ratio • Value adjusted to sales when necessary
Fine Tuning of Values • Once the initial values are generated (Sales or Cost approach) these values are fine tuned • Local field staff review the values for accuracy and consistency (outliers investigated) • Example: Property sold in base year for $500,000 , assessed value $490,000 • ASR is 0.98 (acceptable) • Assessment to Sale Ratio studies completed; final values placed on assessment roll
The Income Approach • Office and Shopping Centre • Values determined using Direct Capitalization by applying an Overall Capitalization rate • Net Operating income is discounted to a present worth (CVA estimate) • The Overall Capitalization Rate (OAR) is derived from the Analysis sales of comparable properties.
Income Approach Steps • Estimate the annual gross potential income of the property less likely future vacancies and bad debts. 2. Estimate the total annual operating expense. 3. Calculate the net operating income. 4. Select an appropriate capitalization rate. 5. Convert the net income into an indication of the capital value of the property.
Valuation Calculation: Free Standing Office • Assume eight stories with no excess land (on site surface parking) • Total leased area: 80,000 s.f. • Market rent: $18.00 psf • Gross Potential Income: $1,440,000 • Less: Vacancy and Bad Debt at 6% or $86,400
Valuation Calculation: Free Standing Office (cont’d) • Less: Non Recov Expense @ 5% or $67,680 • Net Operating Income $ 1,286,000 • Overall Cap Rate: 8.0% • Value: $1,286,000 / .08 = $16,100,000 • Income formula: • Value = Net operating income / capitalization rate