Download
1 / 32
330 likes | 496 Views
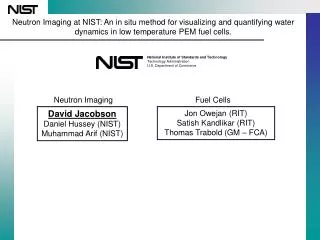
Neutron Imaging at NIST: An in situ method for visualizing and quantifying water dynamics in low temperature PEM fuel cells. National Institute of Standards and Technology Technology Administration U.S. Department of Commerce. Neutron Imaging. Fuel Cells. David Jacobson

E N D
Neutron Imaging at NIST: An in situ method for visualizing and quantifying water dynamics in low temperature PEM fuel cells. National Institute of Standards and Technology Technology Administration U.S. Department of Commerce Neutron Imaging Fuel Cells David Jacobson Daniel Hussey (NIST) Muhammad Arif (NIST) Jon Owejan (RIT) Satish Kandlikar (RIT) Thomas Trabold (GM – FCA)
Support • DOE – Energy Efficiency and Renewable Energy • Interagency agreement # DE\_AI0101EE50660 • Nancy Garland Program Coordinator • DOC – NIST • NIST Directors office competence funding • NIST Intramural Advanced Technology Program • Gerald Caesar • NIST Physics Laboratory (www.physics.nist.gov) • NIST Center for Neutron Research (www.ncnr.nist.gov) • Patrick Gallagher (director), and many others who provide tremendous technical assitance.
Some Neutron Radiography Facilities • Paul Scherrer Institute - NEUTRA • Pennsylvania State University - Breazeale Nuclear Reactor Facility • Institute Laue Langevin (Grenoble, France) • FRM-II (Munich, Germany) • JRR-3M (JAERI) (Japan) • HANARO (KAERI) (Taejon, Korea) • Many other smaller reactors
LN Cooled Bismuth Filter Neutron Imaging Facility (NIF) 6 meter flight path Beam Stop Drum shutter and collimator 2.13 m • New facility 14.6 m2 (157 ft2) floor space • Accessible 2 meters to 6 meters • Variable L/d ratio • At 2 m L/d = 100 → ∞ • At 6 m L/d = 300 → ∞ • Maximum Intensity without filters • At 2 m = 1 x 10⁹ n cm-2 sec-1 (L/d =100), 8 cm diameter beam size • At 6 m = 1 x 10⁸ n cm-2 sec-1 (L/d =300), 25 cm diameter beam size • Maximum Intensity with 15 cm LN cooled Bismuth Filter • At 2 m = 2 x 10⁸ n cm-2 sec-1 (L/d =100), 8 cm diameter beam size • At 6 m = 2 x 10⁷ n cm-2 sec-1 (L/d =300), 25 cm diameter beam size • Support for fuel cell experiments • Hydrogen flow rates 18.8 lpm • 50 cm2 fuel cell controller with 5 lpm flow rates. • Nitrogen, Air, Coolant and Hydrogen Venting • Detection capabilities • Real-Time Varian Paxscan, 30 fps @ 0.254 mm pitch or 7.5 fps @ 0.127 mm pitch • Second Varian detector will upgrade to 30 fps @ 0.127 mm pitch • 2048 x 2048 Cooled (50° C) Andor CCD based box with 30 cm maximum field of view. • 2 more 1024 x 1024 Cooled (30° C) Apogee CCD based • Sample Manipulation • Motor controlled • 5 axis tomography capability • Open for business January 2006 Cable Ports Cable Ports Steel pellet and wax filled shield walls
Fuel cell Neutron sensitive screen Point Source
Why Neutrons Neutrons are an excellent probe for hydrogen in metalsince metals can have a much smaller cross section to thermal neutrons than hydrogen does. Sample • N – numerical density of sample atoms per cm3 • I0 - incident neutrons per second per cm2 • - neutron cross section in ~ 10-24 cm2 • t - sample thickness t Comparison of the relative size of the x-ray and thermal neutron scattering cross section for various elements. x-ray cross section H D C O Al Si Fe neutron cross section
Wet cuvet Dry cuvet water only = 1 s exposure time -ln = 50 micron water thickness Water Sensitivity • Steps machined with 50 micron. • CCD camera exposure of 1 s yields a sensitivity of 0.005 g cm-2 s-1 • After 100 s a factor of 10 improvement gives 0.0005 g cm-2 s-1 • New amorphous silicon detector should have a least a factor of 7 improvement in temporal sensitivity
Sensitivity required for fuel cells (assumes maximum water content) • Flow fields 0.020 g cm-2 • Gas diffusion media 0.012 g cm-2 • Electrode 0.0005 g cm-2 • Membrane 0.0005 g cm-2
Converts neutrons to light 6LiF/ZnS:Cu,Al,Au Neutron scintillator CCD • Neutron absorption cross section for 6Li is huge (940 barns) 6Li + n0 4He + 3H + 4.8 MeV • Light is emitted in the green part of the spectrum Neutrons in Green light out • Neutron to light conversion efficiency is 20% Scintillator
Real-Time Detector Technology • Amorphous silicon • Radiation hard • High frame rate (30 fps) • 127 micron spatial resolution • Picture is of water with He bubbling through it • No optics – scintillator directly couples to the sensor to optimize light input efficiency Helium through water at 30 fps Front view Scintillator aSi sensor Readout electronics Side view Neutron beam scintillator aSi sensor
New technology • Currently the spatial resolution is of order 100 microns • Not a fundamental limitation, but is due to light blooming out in the ZnS, which is 0.1 mm – 0.3 mm thick • Currently have tested detectors with 30 micron resolution (potentially 15 microns). • Major innovation in detection technology • Resolution has been measured to be 30 microns • Final testing and development expected to be completed in 2006
Neutron conversion to electron pulse Neutron ~5-10 µm channels 4He 7Li e- e- e- 10B e- e- Secondary Electrons ~25 mm Secondary e- emitting channel wall Typical MCP structure Borated MCP Neutron Detection Mechanism 10B 7Li + 4He + Q (2.79 MeV)
Orientation of Cell in all Images The flow field geometry was selected to have DP and land width that model full scale hardware channel width = 1.37mm; channel depth = 0.48 mm; land width = 1.45 mm Inlet Anode Inlet Cathode
Orientation of Cell in all Images The flow field geometry was selected to have DP and land width that model full scale hardware channel width = 1.37mm; channel depth = 0.48 mm; land width = 1.45 mm Inlet Anode Inlet Cathode
Amount of Water Possible Volume of one channel = 0.176 cm3 Volume of one port = 0.050 cm3 Volume of one flow field = 0.980 cm3 Volume of anode DM + cathode DM (70% porosity) + electrode (50% porosity) + membrane (20% uptake) = 1.160 cm3 Max water volume possible = 3.12 cm3
Three DM Used Toray 060/090 Teflon Ground SGL 21 BC SGL 20 BC Test Parameters Gore 25mm 0.4/0.4 mg Pt/cm2 Rectangular channels with no PTFE Coating 80°C 2/2 Stoich H2/Air 100 kPag 100% Humidified Exit RH approx. 150% 1 hr 0.6V Start Up Gas Diffusion Media Study
Comparison of Permeability Permeability Current Density A/cm2
Excluding the Water in Channels Permeability Current Density A/cm2
Channel Geometries explored • Rectangular channels • Water flow is laminar tending to constrict and plug the channels • Water plugs form as large slugs and can be difficult to remove. • Triangular channels • Water stays at the corner interface with the diffusion media leaving the apex of the channel more clear. • Water tends to come out in smaller droplets instead of large slugs, which require a high pressure differential to remove
Flow Field Properties Gold Coated w/PTFE Contact Angle = 93° Gold Uncoated Contact Angle = 50° 1.37 mm 1.45 mm 0.38 mm Rectangular X-sect Xsect Area = 0.52 mm2 1.37 mm 1.45 mm 94° 0.76 mm Triangular X-sect Contact Resistance Values
Test Parameters 100% Humidified 80°C 100kPag Approx. 150% exit RH 1 Hr 0.6V Start Up Gore 25mm 0.4/0.4 Toray 060/090 Teflon ground Cathode Flow Field Variation (Anode constant rect. x-sect no coating) 2 Channel Geometries Rectangular Triangular 2 Surface Energies Gold Gold coated ionic PTFE 4 Cathode FFs Total Rect and Tri (gold only) Rect and Tri (gold coated w/ ionic PTFE) Cathode Channel Cross Section Geometry and Surface Energy Study
Rectangular Comparison 0.5 A/cm2 Uncoated PTFE Coated
Triangular Comparison 0.5 A/cm2 Uncoated PTFE Coated
Geometry Comparison 0.5 A/cm2 Uncoated Rectangular Uncoated Triangular
Key Observations and Conclusions • For all cells tested, water accumulation in the channels decreased with load, while accumulation in the diffusion media/MEA increased with load. • There was a significant difference in channel water retention for Toray and SGL materials due to material surface energy.
Key Observations and Conclusions (cont’) • Lower cell performance at 1.0 A/cm2 using Toray is associated with only 0.05 g more water accumulation in the channels and non-channel regions. • Channel surface energy has a consistent effect on water slug shape and size. Higher contact angle increases average water mass retained, but distribution of smaller slugs more evenly in the channel area increases performance. • Triangular cross-sectional geometry accumulates water in the corners adjacent to diffusion media. The center of the channel does not become obstructed by stagnant slugs.