Download
1 / 17
180 likes | 379 Views
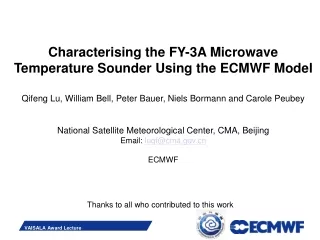
Characteri s ing the FY-3A Microwave Temperature Sounder Using the ECMWF Model Qifeng Lu, William Bell, Peter Bauer, Niels Bormann and Carole Peubey National Satellite Meteorological Center, CMA, Beijing Email: luqf@cma.gov.cn ECMWF. Thanks to all who contributed to this work. Outline.

E N D
Characterising the FY-3A Microwave Temperature Sounder Using the ECMWF Model Qifeng Lu, William Bell, Peter Bauer, Niels Bormann and Carole Peubey National Satellite Meteorological Center, CMA, Beijing Email: luqf@cma.gov.cn ECMWF Thanks to all who contributed to this work
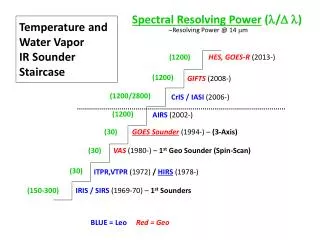
Outline • Microwave sounding data in NWP and climate research: operational satellites from the US, Europe & China : 1978-2020 • China’s FY-3A satellite: The Microwave Temperature Sounder (MWTS) • Identifying and characterising MWTS biases using NWP fields: • Passband shifts • Radiometer non-linearities • Improved Assimilation of MWTS • Summary and conclusion • Next Steps: Early results from the evaluation of MSU and AMSUA from 1978-2011
Operational Sounding Satellites US Europe China • Microwave sounding data provides information on temperature and humidity which has been widely used in : • Operational NWP data assimilation systems and; • Climate research – to determine long term trends in atmospheric state • The US has launched a series of polar satellites, dating back to 1978; • Europe began to contribute in 2006 (MetOp-A) • China began to contribute in 2008 (FY-3A)
The importance of MW sounding data in NWP Largest positive impact (per system) is obtained from microwave temperature sounding data Forecast sensitivity to observations (FSO) Is an adjoint based technique for assessing the influence of observing systems on forecast accuracy (from C. Cardinali, ECMWF)
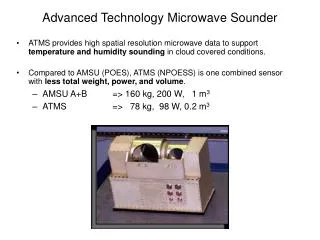
The FY-3A/B Instrument Suite ok Microwave Radiation Imager 10 channels (~AMSR-E) Infrared Atmospheric Sounder (IRAS) 20 channels (~HIRS/3) Microwave Temperature Sounder (MWTS) 4 channel (~MSU) Microwave Humidity Sounder (MWHS) 5 channel (~MHS) 5
Characterize the MWTS Comparison of MWTS and AMSU-A Brightness Temperatures 2 1 State dependent inter-satellite (MWTS vs AMSU-A) biases:Region 1 (tropics): MWTS TBs warm relative to AMSU-ARegion 2 (high northern latitudes) : No significant biasBrightness temperature map from cycle 2008091700
MWTS & AMSU-A Channel Specifications • Microwave temperature sounders operate at 50-60 GHz in the O2 absorption band • The frequency of the channel pass band centre determines the layer sounded • MWTS is a 4 channel instrument, similar to earlier US MSU instruments • AMSU-A is a 14 channel radiometer.
State dependence of frequency drift errors : lapse rate dependence 4 3 2 • Passband shifts raise / lower the weighting function peak • The resulting TB bias depends on the local temperature lapse rate
Optimisation of pass band centre frequency estimates Pass band centres: design spec. measured optimised • Shifts exist relative to pre-launch measurements
MWTS Radiometer Non-linearity ΔTMAX FIRST GUESS DEPARTURES • design specified pass band • pre-launch measured • optimised • non-linearity corrected
Characterising the FY-3A MWTS: Detecting and Correcting passband errors and Non-linearities First Guess Departures (K) ,i.e., Observation minus Simulation MWTS-3 MWTS-4 MWTS-2 Pre-launch measured passband Optimised passband • from line-by-line modelling • uncertainties of ~32-55 MHz • detected and corrected Non-linearity corrected AMSU-A equivalent
Improvement due to MWTS data MWTS OSEs Forecast Verification: Z at 200, 500 and 700 hPa Normalised differences in RMS Errors in Z, verified against own analysis 90% confidence intervals shown Small improvements in SH in going from: original data → recalibrated (low weight) → recalibrated (high weight) NH close to neutral with some benefit in recalibrated data PRELAUNCH_MWTS (full system + original MWTS data) HIOBSERR_MWTS (Full system + optimised MWTS with low weight) LOWOBSERR_MWTS (Full system + optimised MWTS with high weight)
Summary • FY-3A data has been evaluated at ECMWF through a comparison with simulated radiances & full assimilation experiments in which FY-3A data is introduced in the ECMWF system. • The study revealed, and corrected, biases in FY-3A MWTS related to : • Uncertainties in the passband centre frequencies • Radiometer non-linearities • These corrections bring the MWTS data close to the quality of equivalent AMSU-A data & in assimilation experiments this MWTS data delivers improvements in forecast accuracy. • The high value of NWP in Cal/Val of new satellite sensors has been clearly demonstrated – further improvements in FY-3A and FY-3B data are expected, and it is hoped NWP will again play a crucial role for FY-3C, …. FY-3G ! • A powerful new general approach to diagnosing an important group of biases affecting microwave sounders has been developed. • This work demonstrates the significant benefits of close collaboration between satellite agencies and NWP centres.
Next Steps: Initial results from an evaluation of MSU and AMSUA from 1978
MSU CH3 (54.96 GHz): NOAA-6 to NOAA-14 Frequency Shift / MHz • Blue dots represent FG_DEP after shift correction • Colour dots before STD(FG_DEP) Improvement in STD(FG_DEP) • LbL modelling based on ERA-Interim fields • 1 cycle per month: 1979 -2011
Finally … Thanks ! • The authors are honored to receive the Second Vaisala Award for 2012 and are very grateful to the Award Committee for recognising our work. • We would also like to acknowledge the contribution of colleagues from across the world (from CMA, ECMWF, UK Met Office and others besides) who made this work possible • And finally - thanks to the local CIMO-TECO-METREOREX organising committee for their hospitality here in the wonderful city of Brussels !