Download
1 / 33
330 likes | 413 Views
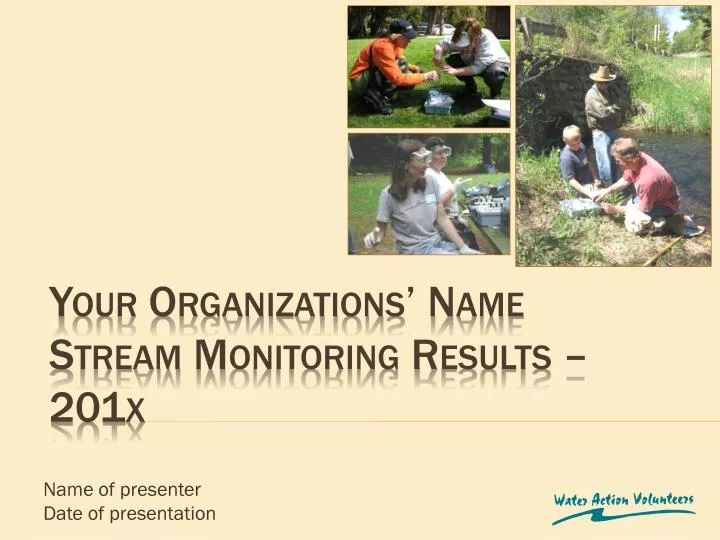
Name of presenter Date of presentation . Your Organizations’ Name Stream Monitoring Results – 201x. To help preserve and protect Wisconsin’s over 15,000 lakes and 86,000 miles of rivers. . Why do we monitor our waters? . Educate citizens about the status of our water.

E N D
Name of presenter Date of presentation Your Organizations’ Name Stream Monitoring Results – 201x
To help preserve and protect Wisconsin’s over 15,000 lakes and 86,000 miles of rivers. Why do we monitor our waters?
Obtain water resource data useful for DNR and local decision-making
DATA USE EXAMPLES • Characterize a stream or region • Assess long-term water quality trends • More data on streams for state and federal reporting • Assess potential of streams to support trout • Restoration
What’s monitored -- Level 1 • Water temperature • Transparency • Macroinvertebrates • Habitat • Dissolved Oxygen • Stream Flow
What’s monitored -- Level 2 • Continuous temperature • pH • Dissolved Oxygen • Transparency
What’s monitored – Level 3 • Varies among projects • Projects have included: • E. coli monitoring • Crayfish survey • Treatment plant outfall thermal assessment • Specific conductance and chloride • Phosphorus • Stream flow methods comparison • Other research projects with DNR biologists
Temperature change affects all aquatic life Warmer water holds less oxygen than cold water Turbid or cloudy water heats up faster Turbid or cloudy water hinders light penetration necessary for plant growth and production of dissolved oxygen. Dissolved Oxygen is necessary for all plants and animals. Lower levels can cause death or distress to animals. Transparency or Water Clarity can be a useful indicator of runoff from construction sites, industrial discharges & other sources Source: Gatzke/Shaw
Temperature • Number of sites • Frequency of collection Our results: temperature
Turbidity can affect: • Sight feeders • Water temperature • Plant growth (therefore oxygen production) Our results: TRANSPARENCY (Clarity)
12, Plant growth hindered 8-20, Brook trout use more energy to find food; decline in distance over which they can detect prey 15-30, Decline in distance over which rainbow trout can detect prey 30-60, Decline in distance over which bluegill can detect prey 25, Salmonid gills irritated, ability to find food declines; perch growth & foraging declines 40, Brook trout growth rates decline, increase in macroinvertrbrates floating freely downstream OUR Results: Transparency
n =10,814 OUR results:Transparency
D.O. levels below 2 mg/L generally don’t support aquatic life D.O. below 4 or 5 mg/L won’t support life for long. D.O. above 7 mg/L is preferable for trout Our results: Dissolved Oxygen
10 samples below 6 in 20 streams in six counties (Adams, Eau Claire, Milwaukee, Ozaukee, Price and Wood) 12 samples above 9 in eight streams in seven counties (Adams, Douglas, Eau Claire, Marquette, Milwaukee, Ozaukee, and Price) Our Results: pH
A way to rate water quality based on organisms that live in the water. • How Healthy is the Stream? • Excellent, 3.6+ • Good, 2.6 - 3.5 • Fair, 2.1 - 2.5 • Poor , 1.0 - 2.0 Our results: Macroinvertebrates- Bugs
The volume of water moving past a cross-section of stream over a set period of time Measured in CFS= cubic foot per second Defines the shape, size, and course of the stream Our results: Flow
Riparian zone (stream edge) • Vegetation • Stream bank condition • Substrate (stream bottom) • Rocky vs. soft • Water characteristics • Pools, riffles, and runs Our results: habitat
Volunteer Requirements • What skills to you need? • Interest in monitoring • Able to walk along stream banks & enter water • Enjoy the outdoors!
Attend annual training in spring • Field & classroom • Monthly data collection • Enter data online • Share equipment with others • Collect & return temperature loggers in fall Volunteer Requirements
Your website • Your email • Your phone number • Other resources • http://watermonitoring.uwex.edu/wav/ • http://dnr.wi.gov/topic/surfacewater/monitoring.html Contact us