Developing Datasets
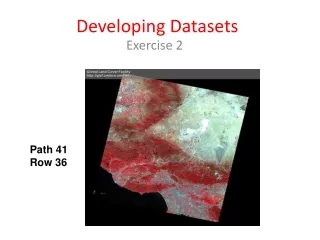
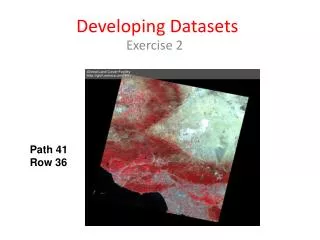
Developing Datasets. Exercise 2. Path 41 Row 36. Exercise #2: Develop Datasets for Projects. Landsat imagery available for projects datasets can be found on the Global Land Cover Facility Website: http://www.glcf.umd.edu/data/landsat/ read through · Overview · Description

Developing Datasets
E N D
Presentation Transcript
Developing Datasets Exercise 2 Path 41 Row 36
Exercise #2: Develop Datasets for Projects • Landsat imagery available for projects datasets can be found on the Global Land Cover Facility Website: http://www.glcf.umd.edu/data/landsat/ read through ·Overview ·Description ·Technical Guide ·Data Download Guide ·File Format Guide
About GLCF Global Land Cover Facility provides earth science data to help better understand global environmental systems. • Primary data and products available at the GLCF are free to anyone via FTP. Online datasets may be accessed electronically through Earth Science Data Interface The majority of users accessing GLCF data come from: • Science: geography, Earth science, ecology, climatology, conservation, education • Environmental Policy: global warming, sustainable development, risk manage. • Resource Management: biodiversity assessment, forestry, protected area manage. • Disaster Management: fire, flood, drought monitoring, disaster mitigation
Overview: Landsat imagery available since 1972 from seven satellites in Landsat series. Major component of NASA's Earth observation program, with three primary sensors evolving over thirty years: MSS (Multi-spectral Scanner), TM (Thematic Mapper), and ETM+ (Enhanced Thematic Mapper Plus). Collection of Landsat available through GLCF is designed to compliment overall project goals of distributing a global, multi-temporal, multi-spectral and multi-resolution range of imagery appropriate for land cover analysis.
Landsat Technical Guide – read it, it’s short! • File Format Guide - read it, it’s short! Files are available in a variety of formats. Some data collections are available in more than one format.
Details about the GeoTIFF format • Standard GLCF format – well suited for imagery and other raster spatial files. • Public domain format - basic TIFFs (Tag(ged) Image File Format) utilize geospatial tags imbedded within the TIFF file. • Most RS/GIS software will read these internal tags and automatically import a spatial coordinates and additional info (map projection, datum, etc.).
L1G • L1G - level of processing for Landsat imagery that indicates the imagery is ready to use. • L1G translates as "Level 1G“ - data has been processed to level 1 and is radiometrically and geometrically corrected.
Details about the BSQ format • Stores imagery as a flat binary file with header information located in a separate metadata file. • BSQ = "Band Sequential" format - popular standard in image formats. • Each image band is written as one independent file • As opposed to formats such as a multi-band GeoTIFF (where all the bands are in one file), BSQ data sets give the user the option of only downloading the relevant bands.
1. Landsat imagery available for projects datasets can be found on the Global Land Cover Facility Website: http://www.glcf.umd.edu/data/landsat/2. Under Data Access you will click on this button to get to the data interface Under Data Access you will click on this button to get to the data interface screen: Click on these to access data:
Worldwide Reference System (WRS) - Global notation system for Landsat data. • Enables user to inquire about satellite imagery over any portion of the world by specifying a nominal scene center designated by PATH and ROW numbers. • Valuable for the cataloging, referencing, and day-to-day use of imagery transmitted from Landsat sensors. landsat.gsfc.nasa.gov/about/wrs.html
4. On the left side click on ETM+ and TM.Note the range of path and rows needed to ‘box in’ Southern California. 5. At the top there are tabs that can make it easier for choosing your location
Now use this link http://landsat.usgs.gov/tools_latlong.phpto figure out how many rows and paths there are in total (globally). a. What is the latitudinal extent of the path/row system?b. What is the path/row of zero degrees latitude and longitude
Steps 6 – 8You will end up choosing two scenes (2 years) from the data interface and download it (Be sure to create a folder for yourself under GIS courses\GEO420).Download bands 1 – 7 , and the browse or preview jpg for each year.
Step 9: I found scenes in Path 40 Row 36 for years, 1990, 1996, 2000, 2005
Step 10 – Look at the file structure.What does the .gz mean at the end of the files that contain the bands? What is your next step to get rid of the .gz?
Using one of the files you download as an example identify the different parts of it (path, row, date, band, etc.) • Example image filename: p129r032_7dt20000611.SR.b01.tif.gz • Path and row of scene are 129 and 032 • Landsat mission number is 7 • Acquisition date is 2000:06:11 represented as 20000611 • Band number for this file is 01 (band 1).
Steps 11 – 12 Downloadng You downloaded data compressed data and used a utility to uncompress it. My sample dataset is path 41 row 36 path 41, rrr = start row 36, landsat 5, 1989 June 28, Band #, TIF = geotiff file extension
.img Files - ERDAS IMAGINE uses .img files to store raster data. • rrd - raster pyramids - amount of detail you see when drawing a raster depends on its cell size. • To speed up the display of large rasters, you can create pyramids in which the original data has several levels of resolution • With pyramids, a lower resolution copy of the data displays quickly when drawing the entire dataset. • As you zoom in, levels with finer resolutions are drawn; performance is maintained because you're drawing successively smaller areas.
Hello, The same atmospheric correction was applied to all SR images. However, the correction is based on atmospheric data and models optimized over large regions. There may be minor discrepancies in individual images. Thanks, Katie Collins Global Land Cover Facility -----Original Message-----From: sagarver@csupomona.edu [mailto:sagarver@csupomona.edu] Sent: Thursday, April 25, 2013 3:26 PMSubject: Hazy landsat scences (GLCF #128564) Below is the result of your feedback form submitted by Sara Garver Thursday, April 25, 2013 message: Hi, My students are downloading path 41 row 36 LA area scenes for two different years (1989 and 2005)and we're noticing that the 2005 scene is very hazy in a 321 combination and also in a 432 combination where we've dropped the blue band. I'm wondering if the 2005 scene had a different atmospheric correction applied to it but I don't see anything in the metadata. Thank you, Sara Garver Cal Poly
Now you’re in ErdasSteps 13 - 14 Importing Landsat data into ERDAS and save as .img files. Use Manage Data/Import DataFor format choose GeoTIFF
Steps 13 – 14 Create a multiband dataset On the main ERDAS menu bar go to Raster/Spectral/Layer StackAfter Input File, choose the bands you want to stack (one at a time) and click Add. This adds all the individual data bands that are to be "stacked.“ Enter an Output File name and click OK.
These are the bands you want to put into your multi-band dataset 1. Band 1: 0.45-0.52 µm – blue 2. Band 2: 0.52-0.60 µm – green 3. Band 3: 0.63-0.69 µm – red 4. Band 4: 0.76-0.90 µm – near infrared 5. Band 5: 1.55-1.75 µm – middle infrared 6. Band 6: 10.40 - 12.50 µm – thermal 7. Band 7: 2.08-2.35 µm – middle infrared.
Step 15 Subset Image (Create smaller area for project dataset) • Use the Inquire Cursor to find a location you want to start with. There are a variety of web pages you can use to help you locate places on the image: • Google Earth, Bing Maps • To get latitude/longitude from a street address: itouchmap.com/latlong.html • To convert lat/long between decimal degrees and deg, min, sec: www.fcc.gov/mb/audio/bickel/DDDMMSS-decimal.html • You can also enter latitude and longitude (in decimal degrees) into google maps, very handy!
Example: My address: 516 W. 9th St. Claremont CA 91711My latitude 34.102343 N, longitude 117.722791 W, (N 34° 6' 8.4342, W 117° 43' 22.0476)My UTM coordinates 433328 easting, 3773798 northing
Steps 15 – 17Subset Image (Create smaller area for project dataset)Your study area (subscene) should be roughly 75 x 75 miles. Now choose the Inquire Box to identify your study area. A small rectangular box appears in the image, and a dialog box appears that contains the map or file coordinates of the Inquire Box. • In the Inquire Box dialogboxchoose Type: lat/long. Left-hold the mouse button and you can move the box and resize it by dragging. • To Subset that region go to Raster/Subset. The Subset dialog box appears. You have to specify an input and output file. The input file will be the same file you are viewing, with the inquire box defining your area of interest (AOI). The output file should go into the directory you created for this project. Click OK.
The Subset dialog box appears. You have to specify an input and output file. The input file will be the same file you are viewing, with the inquire box defining your area of interest (AOI). The output file should go into the directory you created for this project.
What needs to be turned in: A Paragraph describing your study area; Where is your study area located? What two years are you comparing? What land covers and/or land uses do you observe in your images that you want try and identify? What are the coordinates (latitude/longitude of the 4 corners) of your study area Include a jpeg of your study area from Google Maps, google earth, etc.