How stable is your estuary?
460 likes | 692 Views
How stable is your estuary?. Lex Nielsen. Structure of Presentation. What is estuary stability? Example of an unstable estuary Estuary stability theories Inadequacy of estuary stability theories Indicators of estuary stability Conclusions & Recommendation. Estuary Stability.

How stable is your estuary?
E N D
Presentation Transcript
How stable is your estuary? Lex Nielsen
Structure of Presentation • What is estuary stability? • Example of an unstable estuary • Estuary stability theories • Inadequacy of estuary stability theories • Indicators of estuary stability • Conclusions & Recommendation
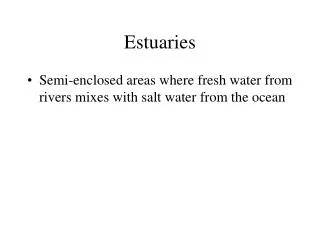
Estuary Stability A stable estuary is: • An estuary where the cross-sectional area of the entrance channel is in dynamic equilibrium with the spring tidal discharge • Not an ICOLL
Wallis Lake Entrance Tuncurry breakwater constructed 19661951 1991 2005
Wallis Lake – tidal range Tuncurry Breakwater Constructed 1966
Impacts of scouring at Wallis Lake entrance • Improves tidal conveyance • Reduces flooding • Salt marsh/mangroves? • Oyster production (increase?) • Boating safety (decrease?)
Estuary Stability Theories • Empirical • O’Brien (P/A relationship) • Per Bruun (P/Mtot relationship) • Analytical • Brown/Escoffier/O’Brien & Dean
O’Brien (1931 and others) A = 4.69 10-4× P 0.85 where: A = minimum inlet cross-sectional area below mean sea level (ft2) P = spring tidal prism (ft3). • This applies only to equilibrium (stable) estuaries • Doesn’t work for or tell you if P or A are changing
Per Bruun (1977) P/Mtot = small (<50) – estuary closes = large (>150) – estuary stable where: Mtot = total amount of littoral drift transport to the inlet ; P = tidal prism. • Doesn’t tell you if P is changing
Brown (1928); Escoffier (1940); Keulegan (1967); O’Brien & Dean (1972)
Problems with “stability theories” • Empirical: • Rely on knowing what is the tidal prism • O’Brien does not tell you if and how an estuary may be changing • Stable relationships are approximate • Analytical: • Cannot be applied if more than one variable is changing • Unrealistic to schematise most real estuaries so simply as assumed
How can we tell if an estuary is stable? • Establish long term tidal stations (Manly Hydraulics Lab) • Look at the time history variations in the amplitudes and phasing of the tidal constituents
Tidal Data Monitoring by MHL • Have established tidal stations now in most estuaries > 10 years • Undertake annual tidal harmonic analyses • Heaps of data just waiting to be analysed • Data herein generously provided to me by MHL for this private research
Tidal Harmonic Analysis • Based on > 8,000 tidal stage height measurements each year • Equivalent to a water level reading every hour for a year • Breaks up the complex tidal wave signature into 69 sine curves each with its own amplitude and phase lag
Semidiurnal constituentsDiurnalConstituentsPredicted TideMeasured Tide
The following most significant tidal constituents are used herein for the analysis of several estuaries: • M2 - Principal lunar semidiurnal constituent • S2 - Principal solar semidiurnal constituent • K1 - Lunar diurnal constituent • O1 - Lunar diurnal constituent
504±5 150±2 123± 1 98±2
Case Studies • The tiny estuary of Coffs Creek – training wall constructed in 1988 • Wagonga – breakwater constructed 1978 – is this estuary stable? • Wallis Lake – breakwaters constructed 1966 – has been in unstable scouring mode until now – when will it stabilise? • Lake Macquarie - Breakwaters constructed 1888 - 120 years ago – is this estuary now stable?
Coffs Creek Training wall constructed 1987
Is Coffs Creek Stable? • Tidal constituent amplitudes and phase lags indicate NO. • Changes are small and will be controlled by • the gravel bar at the inlet and • the indurated sand weir upstream. • But how much further will it go?
Wagonga Inlet (Narooma) Breakwaters constructed 1978
Is Wagonga Inlet Stable? • Tidal range is increasing • Tidal phase lags are decreasing • Wagonga has not reach a stable tidal regime: • the channel will continue to scour • the dropovers will continue to accrete.
Wallis Lake Inlet Entrance channel Lake Tiona
Wallis Lake – stable? • Nielsen & Gordon (1980 – 10 years before these data started to be collected) predicted 50 years after 1966 (i.e., 2016) based on regime theory for channels • Tidal constituents amplitudes indicate that it is close. • Phase lags indicate 50/50 • Maybe 2016 was a pretty good guess in 1980!
Lake Macquarie Breakwaters constructed 1887
Lake Macquarie (Cockle Creek) amplitudes of the tidal constituents
Lake Macquarie (Cockle Creek) phase lags of the tidal constituents
Lake Macquarie • Lake Macquarie is far from reaching stability even after 100 years: • Swansea channel will continue to scour • Dropovers will continue to accrete
Conclusions (1) • “Stability theories” cannot predict the changing stability regimes of estuaries. • Erudite hydraulic modelling and sediment transport computations are not of a sufficient resolution to identify subtle changes to estuarine hydrodynamics.
Conclusions (2) • The time history of estuary tidal constituents, determined from large data sets (MHL), enables the examination of estuary stability at a fine resolution. • Estuaries may take decades to centuries to adjust to breakwater construction. • Wallis lake is adjusting still after 40 years. • Indications are that Lake Macquarie is adjusting still after 120 years.
Recommendations • All estuaries be instrumented with tidal stations. • All existing data be reduced and examined for subtle changes in the amplitudes and phase lags of the major tidal constituents. • The base data acquisition capabilities of the Manly Hydraulics Lab be supported strongly.