Download
1 / 11
120 likes | 356 Views
Exploring the Standard Deviation : The most widely used measure of a distribution’s spread. Developing Life Expectancies in Botswana. Adpated from Rossman & Chance (2012). Workshop Statistics: Discovery with data. 4 th ed.

E N D
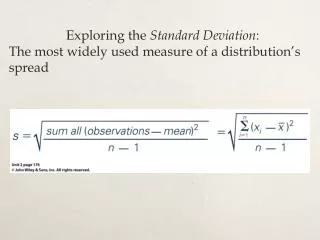
Exploring the Standard Deviation: The most widely used measure of a distribution’s spread
Developing Life Expectancies in Botswana Adpated from Rossman & Chance (2012). Workshop Statistics: Discovery with data. 4th ed.
The mean life expectancy among values reported for Botswana is 54.8 years. a) Complete the missing entries for the years 1995 and 2005 in the Deviation from the Mean column of this table
b) Add the values in the Deviation from the Mean column. Why does the value of this sum make sense?
c) Complete the missing entries in the Absolute Deviation column of the table. Then add those absolute deviations.
d) Calculate the average (mean) of these absolute deviations. What is the unit of measure of this quantity? The measure of spread you have just calculated is called the mean absolute deviation (MAD). It is intuitively sensible but not widely used.
An alternative to working with absolute deviations (MADs) which still avoids any data contributions having negative values is to square the deviations from the mean. e) Complete the missing entries in the Squared Deviations column of the table. The add those squared deviations.
For technical reasons, we average these squared deviations over n-1=8 data values, instead of the sample size n = 9. [reason to be explained later in the course] f) Divide the sum of the Squared Deviations by 8. What is the unit of measure of this sum? g) To convert back to the same unit of measure as the data values (years instead of years squared), take the square root of your value from part f.
Go to our course web site: http://math.la.asu.edu/~saldanha/STP420Webpage/ Open the Jan. 22 tab and download the data file LifeExpectancies.txt Open DataDesk and import this data file into the program h) Open the data file and use DataDesk to verify your calculation of the standard deviation for the Botswana life expectancies (in part g). i) Select the Papua New Guinea life expectancies variable and compute its standard deviation. How do the two values for the standard deviations compare? Is this what you expected? Explain. j) Make a conjecture as to why the variability in Botswana’s life expectancies is so much larger than Papua New Guinea’s.
k) Now suppose that the 1987 life expectancy for Botswana had been incorrectly recorded as 83.5 years rather than 63.5 years. Would you expect this this have much effect on the range? How about the IQR? How about S (standard deviation)? Explain. l) Change this value from 63.5 to 83.5 and recalculate the values of the range, IQR, and S (using DataDesk). Record these values in the table below: What if the value had been incorrectly recorded as 635 instead of 63.5—how would this error change the values of range, IQR, and S?
Which of these measures of spread are resistant to outliers and which are not? Explain how you decide.