Download
1 / 7
70 likes | 82 Views
Graphing System of Inequalities. S. Calahan March 2008. X>-4 and y < -1. First make sure both inequalities are in slope-intercept form. Now graph the first inequality. This shows x = -4. To show x > -4 we must shade the right side of the line x = -4. X>-4 and y < -1.

E N D
Graphing System of Inequalities S. Calahan March 2008
X>-4 and y < -1 • First make sure both inequalities are in slope-intercept form. • Now graph the first inequality. • This shows x = -4. • To show x > -4 we must shade the right side of the line x = -4.
X>-4 and y < -1 • Now shade the right hand side of the line • x = -4. • The dotted line shows that -4 is not included.
X>-4 and y < -1 • Now graph y < -1 on the same graph. • This time we use a solid line because it is equal or less than. • Shade the graph below y = -1.
X>-4 and y < -1 • Now find the common shaded area. • This area is the solution for • X > -4 and y < -1 • So the pink area is the solution. X > -4 Y < -1
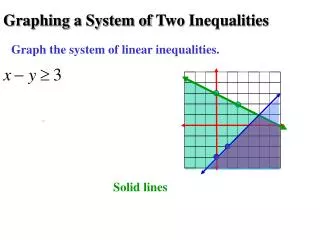
y < 2x + 1 and y > -x + 3 • Graph the first inequality
y < 2x + 1 and y > -x + 3 • Graph the second inequality • The yellow is what they have in common and is the solution.