Download
1 / 62
620 likes | 656 Views
UV-Visible Spectrophotometry is a widely used method for quantitative analysis and structural elucidation in chemistry. Learn about relevant terminology, theory, equations, and laws such as Lambert's and Beer's Law.

E N D
visible spectophotometry & Spectrophotometry
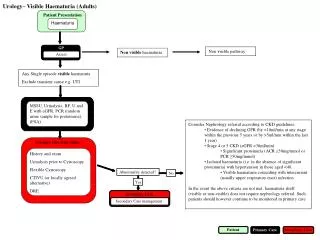
INTRODUCTION • Absorption Spectrophotometry in the ultraviolet and visible region is one of the most oldest methods used for quantitative analysis and structural elucidation. • The ultraviolet and visible Spectrophotometry is mainly used for quantitative analysis and used as a auxiliary tool for structural elucidation.
Useful Terminology • Photometer is an instrument which measuring the ratio, or some function of the two of radiant power of two electromagnetic beams. • Colorimetry is the use of the human eye to determine the concentration of colored species. • Spectrophotometry is the use of instruments to make the same measurements. It extends the range of possible measurements beyond those that can be determined by the eye alone. it use more sensitive detectors.
Colorimetry • Visual Observations – Because colorimetry is based on inspection of materials with the human eye, it is necessary to review aspects of visible light. • Visible light is the narrow range of electromagnetic waves with the wavelength of 400-700 nm. ROYG. BIV = the mnemonic used to remember the colors of the visible spectrum.
Visible light is only a very small portion of the electromagnetic spectrum. Note: Frequency (υ) and Energy (E) are directly proportional whereas Frequency (υ) and Wavelength (λ) are inversely proportional.
Electromagnetic radiation is characterized by its wavelength, , Frequency, and energy, E: E = h= hc / c = Where h = Planck’s constant & c = speed of light in a vacuum. longer wavelength, lower energy; shorter wavelength, higher energy.
Theory of spectrophotometry • When a beam monochromatic light passes through a transparent medium, part of the light is absorbed and the transmitted beam has a lower intensity than the intensity of the incident beam.
The TRANSMITTANCE, T of the solution is defined as the ratio of the intensities of the transmitted beam, P to the intensity, Po of the incident beam: T = P/Po • The ABSORBANCE, A of a solution is defined as • Absorbance A = log10 P0 / P A = log10 1 / T A = log10 100 / %T A = 2 - log10 %T A = -log10T Since A is a logarithmic function, it is dimensionless.
Equation Summary T= (I/Io) = 10-A %T = (I/Io) x 100 A = -logT = log(1/T) Sample Calculation If %T = 95%, then A = log(100/95) = log(1/.95) = -log(.95) A = 0.02227 Note the scale for Absorbance: 9/10th of the scale is from 0-1 and 1/10th is from 1-2. For this reason, the spectrometers have been calibrated in % Transmittance and all readings will be taken in %Transmittance.
Lambert’s Law • “When a beam of light is allowed to pass through a transparent medium, the rate of decrease of intensity with the thickness of medium is directly proportional to the intensity of the light” - dI / dt α I Or - dI / dt = kI
Integrating on both sides putting I=I0 When t=0, we get In I0 / It = kt or It = I0 e-kt Where k is the constant which depends on wavelength and absorbing medium used. • Converting to natural log It = I0 10 -0.4343kt = I0 10 -Kt Where K=k/2.3026 which is absorption coefficient, which is defined as “the reciprocal of the thickness which is required to reduce the light to 1/10 of its intensity” I0 / It = 0.1=10-ktor Kt =1 or K α 1 / t
Beer’s Law • Lambert’s law shows that there exists a logarithmic relationship between the transmittance and the length of the optical path through the sample.
Beers observed that a similar relationship between the transmittance and the conc of a solution. i.e “ the intensity of a beam of monochromatic light decrease exponentially with the increase in conc if the absorbing substance arithmetically” It = I0 e-k’c It = I0 10 -0.4343k’t = I0 10 –K’t Where k’ and K’ are constants and c is the concentration of the absorbing substance.
Beer’s Law It = I0 10 -act or log I0 /It = act • This is mathematical statement of Beer-Lambert law. • This is the fundamental for colorimetry and Spectrophotometry. • Where c is the conc expressed in mole dm-3 • t is the path length which is expressed in cm. • a is replaced with Є and is termed as the Molar absorption coefficient or molar absorptivity (molar extinction coefficient)
Beer-Lambert law log I0 /It = act A= act A= Єct Є=A/ct Where A is absorbance (no units, since A = log10P0/ P ) Є is the molar absorbtivity with units of L mol-1 cm-1 b is the path length of the sample - that is, the path length of the cuvette in which the sample is contained. We will express this measurement in centimetres.c is the concentration of the compound in solution, expressed in mol L-1
Deviations from Beer’s Law • Beer’s law states that a plot of absorbance versus concentration should give a straight line passing through the origin with a slope equal to ab. However, deviations from direct proportionality between absorbance and concentration are sometimes encountered. • These deviations are a result of one or more of the following three things ; real limitations, instrumental factors or chemical factors.
Real Limitations • Beer’s law is successful in describing the absorption behavior of dilute solutions only ; in this sense it is a limiting law. At high concentrations ( > 0.01M ),the average distance between the species responsible for absorption is diminished to the point where each affects the charge distribution of its neighbors. • This interaction, in turn, can alter the species’ ability to absorb at a given wavelength of radiation thus leading to a deviation from Beer’s law.
Limitations (cont) • Deviations also arise because e is dependent upon the refractive index of the solution. Thus, if concentration changes cause significant alterations in the refractive index h of a solution, departures from Beer’s law are observed.
Chemical Deviations • Chemical deviations from Beer’s law are caused by shifts in the position of a chemical or physical equilibrium involving the absorbing species. • A common example of this behavior is found with acid/base indicators. • Deviations arising from chemical factors can only be observed when concentrations are changed. eg:dichromate ions on dilution. Cr2O72- + H2O -- 2HCrO4- - 2H+ + 2CrO42- (orange color) (yellow color)
Instrumental Factors • Unsatisfactory performance of an instrument may be caused by fluctuations in the power-supply voltage, an unstable light source, or a non-linear response of the detector-amplifier system.
There are at least six conditions that need to be fulfilled in order for Beer’s law to be valid. These are: • The absorbers must act independently of each other; • The absorbing medium must be homogeneous in the interaction volume • The absorbing medium must not scatter the radiation - no turbidity; • The incident radiation must consist of parallel rays, each traversing the same length in the absorbing medium; • The incident radiation should preferably be monochromatic, or have at least a width that is narrower than that of the absorbing transition; and • The incident flux must not influence the atoms or molecules; it should only act as a non-invasive probe of the species under study. In particular, this implies that the light should not cause optical saturation or optical pumping, since such effects will deplete the lower level and possibly give rise to stimulated emission.
Instrumentation • Source: A continuous source of radiant energy covering the region of spectrum in which the instrument is designed to work. • Filter or Monochromator: Both filter and monochromator allow the light of the required wavelength to pass through but absorb the light of other wavelengths. • Sample cells: All instrument must contain a container for the sample. • Detector: It is used for measuring the radiant energy transmitted through the sample.
Radiation sources • Requirements of a radiation sources • It must be stable. • It must be of sufficient intensity for the transmitted energy to be detected at the end if the optical path. • It must supply continuous radiation over the entire wavelength region in which it is used.
Tungsten filament lamp • It is most common source of visible radiation. • Its construction is similar to the household lamp. But the tungsten wire is heated at controlled atm. • Constant power supply is needed to achieve constant radiant energy.
Drawback of tungsten lamp • Major portion of its radiant energy in the near IR region of the spectrum, i.e only 15% at the operating temp of about 2725o c and only 1 % at 1725o c. • If the temp is increased to 2850o c and above will increase the total energy output and shift the wavelength of maximum intensity to shorter wavelength but the life of the lamp will be reduced.
Tungsten lamp is the most satisfactory for lamp filaments but the carbon arc is used when a more intense source is required. • The energy from a tungsten lamp can be used above 375 nm.
Filters and Monochromators • A Source is generally emits the continuous spectra. • We need a device to select the narrow bands from wavelengths of the continuous spectra. • For that selection we have • Filters and • Monochromators.
FILTERS • A light filter is device that allow light of the required wavelength to pass but absorbs light of other wavelengths wholly or partially. • Filter are two type • 1) absorption filters and • 2) interference filters
Absorption filter • It is a solid sheet of glass on which the color pigments are dispersed. • Absorption filters are classed as either cut off or band pass filters.
Color Wheel (ROYGBIV) Complementary colorslie across the diameter on the color wheel and combine to form “white light”, so the color of a compound seen by the eye is the complement of the color of light absorbed by a colored compound; thus it completes the color.
Interference filters • These filters works on the phenomena of interference. • It has a semi-transparent metal film is deposited on the glass plate. • Then the metal film is coated with thin layer of dielectric material like MgF2. • Followed by another metal film and then glass plate for support.
Monochromators • It is separate the narrow wavelength more specifically then filters. • Monochromators have the following parts • An Entrance slit • A dispersing element (Prism or grating) and • An Exit slit
Replica grating are cheaper than prisms. • Main disadvantage of the gratings is that they produce more then one order of diffraction. • For instance, the second order of 400 mμ may interfere with the first order of 800 mμ. • This can be removed my employing filters in front of the entrance slit to absorb interfering radiation.
Grating • A Grating consist of large number if parallel lines ruled on a highly polished surface such as alumina.( 15,000 – 30,000 lines per square inch) • Grating are very difficult to prepared. Therefore replica gratings are prepared from an original grating using an epoxy resin.
The main advantage of prisms is that they undergo dispersion giving wavelengths which do not overlap. • But the main disadvantage is that they give Non-linear dispersion. • On the other hand gratings give linear dispersion but they suffer from an overlap of spectral orders. • For this reason, filters are employed to reduce the radiation of different orders and stray radiation.
DETECTORS • PHOTOVOLTANIC CELL • PHOTOTUBES • PHOTOMULTIPLIER
Power supply • The power supply serve a triple function • It decrease the line voltage to the instrument’s operating level with a transformer. • It convert alternating current to direct current with a rectifier if direct current is required by the instrument. • It smooths out any ripple which may occur in the line voltage in order to deliver a constant voltage to the source lamp and instrument.
Visual comparators Intensity: For light shining through a colored solution, the observed intensity of the color is found to be dependent on both the thickness of the absorbing layer (pathlength) and the concentration of the colored species. • There are four techniques for color comparison in quantitative visual colorimetry. • Multiple standard method, • Duplication method, • Dilution methods, and • Balancing method-uses Klett Bio colorimeter or Dubosque colorimeter
Multiple standard method • The unknown solution is taken in a 50/100 ml Nessler tube and made up to the mark. • The color of the unknown solution is compared with the series of known amount of the known substance. • The conc of the unknown will be equal to the conc of known if the color matches exactly.
←Side view ←Top view (a.k.a. Bird’s eye view) For One Color: A series of solutions of a single color demonstrates the effect of either concentration or pathlength, depending on how it is viewed.