Download
1 / 24
250 likes | 269 Views
Explore the study of DC breakdowns for CLIC structures, materials, and preparation techniques. Understand the implications of breakdown rates, field gradients, and material properties in RF and DC environments. Discover the impact of surface treatments, alloys, and heat treatments on breakdown conditions. Analyze the conditioning curves of various metals and the breakdown rates versus field values in both RF and DC scenarios. Gain insights into the material ranking and the influence of surface finishing on saturation fields. Learn about breakdown probabilities, power fits, and the normalization of breakdown slopes.

E N D
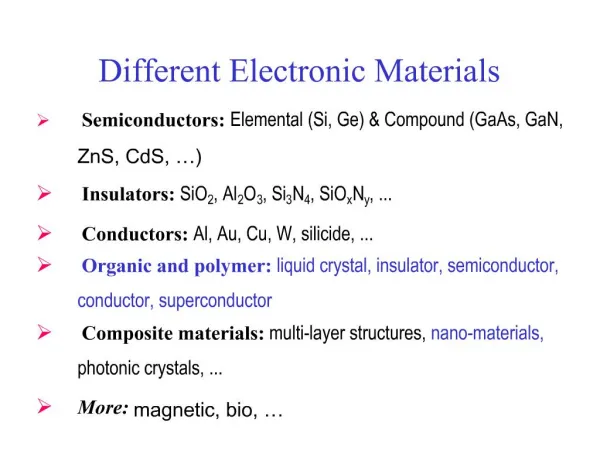
DC Breakdown :Comparison of Different Materials Antoine Descoeudres, Trond Ramsvik,Sergio Calatroni, Mauro Taborelli CERN, TS-MME CLIC Breakdown WorkshopMay 2008
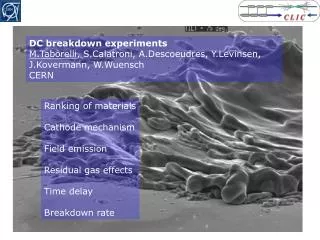
Additional inputs for the design and the choice of the RF CLIC structures (materials, preparation, …) Why do we study DC breakdowns ? high gradient low breakdown rate low structure deterioration after breakdown Materials requirements for CLIC: • Simple set-up to produce DC sparks • DC tests are faster and more flexible • Investigation of : • new materials • surface treatments (mechanical, chemical, plasma, heat, …) • DC breakdowns are easier to understand and to model (?)
Experimental set-up vacuum chamber (UHV 10-10 mbar) m-displacement gap 20 - 30 mm (±1 mm) HV switch HV switch spark cathode (plane) anode (rounded tip, Ø 2.3 mm) power supply (up to 12 kV) V C (28 nF) current probe to scope • max. field : 12 kV / 20 mm = 600 MV/m • typ. spark energy : ½ · (28 nF) · (10 kV)2 = ~ 1 J • 2nd system : higher voltage ( 30 kV), spark energy can be changed for the same field (ex: 10 kV 0.75, 1.4 or 3 J)
conditioning curve, saturated field Eb Eb E remaining Eb nb of breakdown E initial Measurement of the breakdown field Eb 2) 1) V Q
breakdown rate vs field BDR BDR E remaining E nb of attempt Measurement of the breakdown rate (BDR) 1) V fixed value breakdown ? 2)
DC vs RF : what is similar and what is not • pulse duration : 100 ns (RF) s (DC) • area exposed to field : Ø cm (RF) Ø100 mm (DC) • field : 100 MV/m • energy : 1 J • UHV • breakdown initiation: protrusions, field emission, melting, evaporation, gas release, fatigue, …
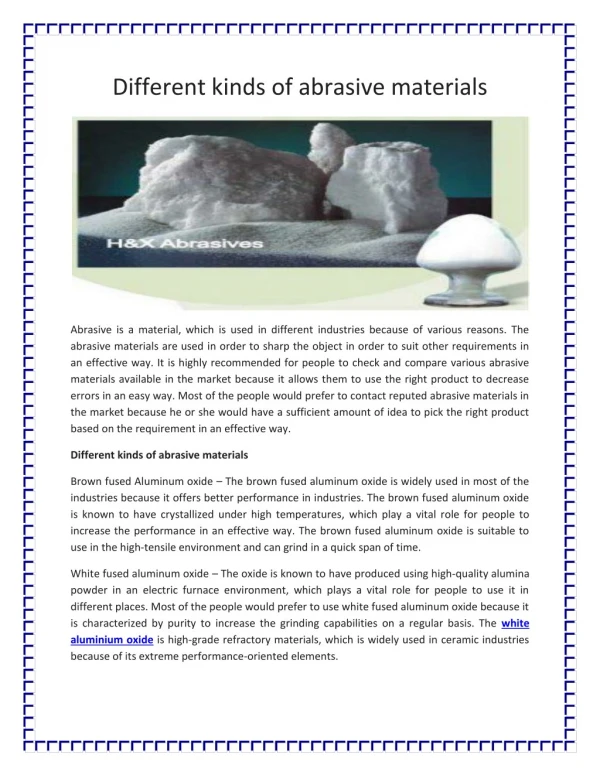
Conditioning curves of pure metals assumption: ‘good material’ = refractory ; oxides easily reduced
Other materials : Alloys • Hard metals Eb = 830 MV/m ! • Copper alloys • Others : • Cu + 500mm Cr coating (≈ Cr) • Ti-Mo (gap unstable) • Mo + 2mm DLC coating (low Eb)
conditioning speed ! ! • gap instability (max. gap variation after a full conditioning experiment) • Cu, W, Mo : same ranking as in RF tests (CTF 2) • difficult to point out 1 dominant physical property, combination of several ones (melting point, heat of fusion, thermal conductivity, electrical conductivity, vapour pressure, surface tension, work function, …) Ranking of materials
Effect of the surface finishing • Glidcop EDM : ~ same saturated field, but much slower conditioning speed (due to surface modification, higher roughness) • Mo
XPS measurements : amount of Mo oxides at the surface reduced after heat treatment • Hardness measurements : 1000°C and 1200°C samples are recrystallized, • 875°C sample is not recrystallized same saturated field conditioning speed improved by oxides reduction 2h at 875°C is a good choice Ex-situ heat treatment (Mo, 2h) • conditioning speed improved ~ 60 sparks ~ 15 sparks ~ 12 sparks ~ 10 sparks (to reach 400 MV/m)
700°C 400°C • Saitama University results (1996) Kobayashi et al., Vacuum 47 745 (1996) Ex-situ heat treatment in oven (Cu, 2h) • Slight improvement in • saturated field (10%)
Breakdown rate : sparks distribution • breakdowns are randomly distributed, but come often by groups no breakdown breakdown • experimentally difficult to go under a breakdown probability of 10-4 (time consuming, poor statistics, frequent mechanical problems with HV switch)
power fit (BDR=0 @ E=0) BDR ~ E30 Breakdown rate vs field : RF (11 & 30 GHz) • Cu structures exponential fit from A. Grudiev
… or different power Cu 70ns Mo 80ns BDR ~ E30 for Cu for Mo BDR ~ E20 Breakdown rate vs field : RF (30 GHz) • different materials different slopes from S. Doebert
Same trend as in RF measurements comparison possible Breakdown rate vs field : DC NB: RF data are plotted vs surface field
! g = power in the fit BDR ~ Eg RF & DC ‘slopes’ are different Mo steeper than Cu in DC Breakdown rate vs field : ‘slopes’ Normalization : ‘how many decades do we gain if we decrease the max. field by X%’
Summary • Various metals and alloys have been tested (Eb, cond speed, gap stability) • Stainless Steel : highest saturated breakdown field, gap stable • Cu, W, Mo : same ranking in RF and DC • difficult to understand the ranking of materials… • Heat treatment of Mo • increase in conditioning speed by removing oxides • DC breakdown rate measurements • Breakdown probability increases ‘exponentially’ with applied field • DC – RF : different slopes, Mo steeper than Cu in DC (?)
Ex-situ heat treatment in oven (Mo, 2h) • XPS measurements : • Amount of Mo oxides at the surface reduced after heat treatment
absolute slope: 1 decade every… 28 MV/m (±6) 27 MV/m (±3) 13 MV/m 11 MV/m 37 MV/m (±5) 28 MV/m RF & DC slopes are different Cu steeper than Mo in both cases Breakdown rate vs field : RF & DC (exponential fit) NB: RF data are plotted vs surface field
slope: # decades over 20% of field@(BDR=1) 1.7 (±0.4) 1.6 (±0.1) 3.8 3 2.8 (±0.4) 2.3 RF & DC slopes are different for Cu, similar for Mo Mo steeper than Cu in DC Breakdown rate vs field : RF & DC (exponential fit) Normalization : ‘how many decades do we gain if we decrease the max. field by X%’