Download
1 / 20
200 likes | 348 Views
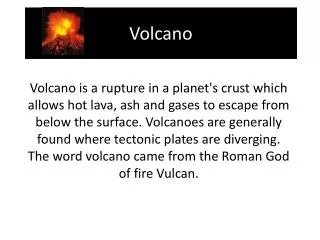
World Organization of Volcano Observatories (WOVO). A loosely-knit organization of and for volcano observatories of the world, engaged in volcano surveillance and, in most cases, responsible for warning about hazardous volcanic unrest .

E N D
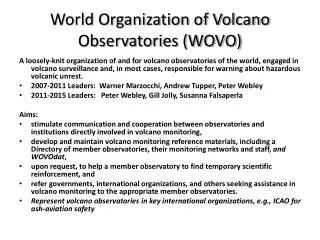
World Organization of Volcano Observatories (WOVO) A loosely-knit organization of and for volcano observatories of the world, engaged in volcano surveillance and, in most cases, responsible for warning about hazardous volcanic unrest. • 2007-2011 Leaders: Warner Marzocchi, Andrew Tupper, Peter Webley • 2011-2015 Leaders: Peter Webley, Gill Jolly, Susanna Falsaperla Aims: • stimulate communication and cooperation between observatories and institutions directly involved in volcano monitoring, • develop and maintain volcano monitoring reference materials, including a Directory of member observatories, their monitoring networks and staff, and WOVOdat, • upon request, to help a member observatory to find temporary scientific reinforcement, and • refer governments, international organizations, and others seeking assistance in volcano monitoring to the appropriate member observatories. • Represent volcano observatories in key international organizations, e.g., ICAO for ash-aviation safety
WOVOdat- philosophy and uses Chris Newhall Antonius Ratdomopurbo Christina Widiwijayanti (and with thanks to earlier workers including Dina Venezky)
WOVOdat • A modern, searchable, web-accessible “epidemiological” database of volcanic unrest • Linked to the Smithsonian database of historical eruptions (outcomes) • For READY REFERENCE, COMPARISONS and STATISTICAL ANALYSES of unrest and its outcomes. • A reference library at your fingertips!
Principal data sources • Volcano observatories (e.g., GNS/Geonet; INGV/DIVO; USGS and partners, etc) • Regional and global observing networks, e.g., IRIS UNAVCO, satellite data (thermal, SO2 & CO2 gas; InSAR, etc) • Individual researchers • Published data (tables, digitized graphs) (especially for old episodes of unrest)
General contents of WOVOdat • Background info re: each volcano and its quiet state, including DEM and metadata re: monitoring nets • Temporal changes in seismicity, ground deformation, gas emission, groundwater pore pressures, and other parameters • Spatial details, e.g., earthquake hypocenters, strain vectors and maps, SAR interferograms, etc. • “Spectral” details, e.g., earthquake spectra, ratios of various gas species • Indicators of data quality, Notes, References • Tools for searches, visualization, and data analysis.
Data are: • Historical (most, ≥2 years old) (moving 2 yr window) • Geospatially-referenced, time-stamped • In common (standardized) formats • “Reduced,” for purposes of searching many episodes of unrest. (e.g., eqhypocenters, GPS positions and deformation vectors, gas fluxes) • Digital, to allow replotting, overlays, analysis
Main uses of WOVOdat: Forecasting, research, and education • For ready comparisons of unrest, from one episode or volcano to the next • For XYZ analogues and outcomes of unrests • As empirical basis for probabilistic forecasts • To understand puzzling unrest • To discover as-yet-unknown patterns of unrest • As data for numerical “eruption simulator” • Educational use – interesting data for teaching basic scientific skills
WOVOdat is NOT for: • Data of current unrest (not real-time) • “Raw” or reduced data on single episodes of past unrest. For those, see URL’s pointing back to observatory and contact person(s) • For research on single episodes or single volcanoes. Much better for non-observatory users to collaborate directly with Observatory staff!
Great example from yesterday’s session:Distal VT earthquakes (dVT’s)e.g. NW of Pinatubo, 1991 • Magma intruding there? If yes, mafic bypass? • Or, marking outer limit of silicic reservoir? • Regional strike-slip activity? • Lubrication of fault by pressurization of geothermal system?
Including: Montserrat, 1934-37, 1995- Tacana 1985-86 Guagua Pichincha 1997-2001 Commonalities: hydrothermal system throughgoing or nearby faults association with phreatic explosions Probable explanation: Pressurization of magma or hydrothermal system raises groundwater pore pressures along faults up to 25 km away Aha! Lots of other examples of DVT’s (earthquakes offset from cone...) After Randy White, USGS
Or, flipping the problem around, given a specified process (e.g., magma intruding through a confined aquifer), what unrest should we expect? Compression (+ve) where r> √2 D Dilatation (-ve) where r< √2 D E.g., if Mogi point source (intrusion) is at 5 km, there will be compression and rise in porewater pressure outside a radius of 1.41x5= 7.1 km. Closer to the summit, porewater pressure and water table will drop
Preeruption increase in spring discharge: example from MontagnePelée • Pre-eruption lahars in 11(!) rivers around Pelée in early May 1902. • Total volume of water ~107 m3, much more than Lac d’Etang draining out! • Compression right in summit region indicated that magma was already very near the surface. • (other water expulsions, at Huila and Matsushiro!)
From Chretien and Brousse, 1989 Widespread preeruption lahars, Pelee, 1902
“Pre-eruption” examples of rising (or falling) water level • Usu 1977: water in well rose 37m (Watanabe, 1983). • Krafla 1977: water in geothermal well rose 85 m as dike passed by 4 km away • Usu 2000: in response to shallow intrusion, water well levels rose > 100 m (Matsumoto et al, 2002) • Many more
Example of water levels at Usu, 2000 3/31 3/27 5 m (Matsumoto et al)
Progress on WOVOdat:See poster by A. Ratdomopurbo! Data already in: • Volcano data, including network info, station maps • Historical eruption data (Smithsonian) • Web-accessible seismic , GPS, and other data (all, catalogue-level) • Digitized scans of epicenters, deformation vectors, time-series data (in progress) Data still to add: • Additional data from observatory and individual files, not open on web (much!) • More digitized scans (but only where original data no longer accessible)
Examples of data sets already in: For Long Valley caldera (just a few of many) • Earthquakes_Caldera_1975-2005 • Earthquakes_Sierra Nevada_1975-2005 • LP_1989-2002 • EW Long Baseline_1997-2006 • NS Long Baseline_1997-2006 • Uplift_CASA-KRAK_1975-1999 • Temperatures_Casa Diablo Fumarole_1994-2005
WOVOdat needs you! • Contacts for each observatory: Director and data manager (Web, WOVO Directory…) • Your uploads of data, ≥ 2 years old (online, www.wovodat.org) • For in-person visits, your time to get WOVOdat team started at your observatory • Alternatively, your visits to EOS • Your volunteers, if you can send them to EOS for at least 1 month. • Your suggestions for maintenance funding
Let’s make WOVOdat work for all of us!Please see us to schedule