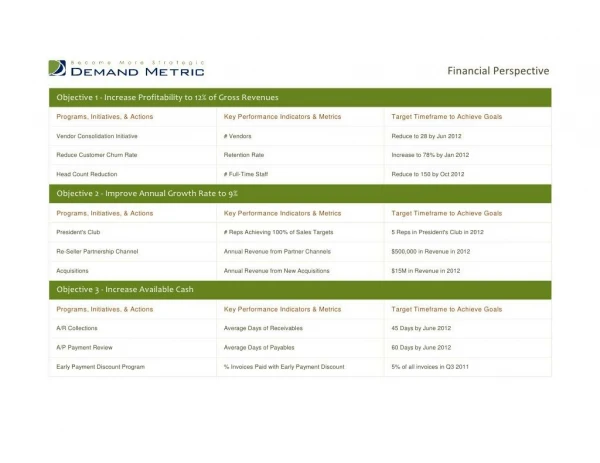
eGovernment Strategy Balanced Scorecard
390 likes | 619 Views
Kamen Spassov Coordination Center for Information Communication and Management Technologies kspassov@ccit.government.bg. eGovernment Strategy Balanced Scorecard. The Management System. Vision and Strategy. Management System. Fundamentals. Projects. Initiatives.

eGovernment Strategy Balanced Scorecard
E N D
Presentation Transcript
KamenSpassov Coordination Center for Information Communication and Management Technologies kspassov@ccit.government.bg eGovernment Strategy Balanced Scorecard
The Management System Vision andStrategy Management System Fundamentals Projects Initiatives
Elements of a Good Management System • Derived from the Vision and Strategy of the organization • Planning • Long term strategic plan • Short term business plan and budgets • Measurement • Focused set of measures • Measures represent the organization’s plan and vision • Review • Plans are regularly reviewed and suitably revised • Performance • Rewards are linked to driving key measures
What isBSC? 85% • A concept that transforms the organization’s strategy into real actions; • A tool to measure activities of the organization; • A management decision making support system; • A technology that integrates actions of all parts around the objectives of the organization Market Share
BSC Philosophy Mission and vision definition 1. Where are we? What are we doing? Where do we want to go? 2. How will we realize our intentions? 3. From which points of view can we look at our organization? 4. What are the factors influencing development in the right direction? 5. How will we measure our activities? 6. What are the results of the monitoring? 7. What will be our actions? Can we complete them? 8. What are benefits of the change? How do we continue? Strategy development Perspectives identification Key success factors Measures Evaluation Action plan Feed back
BSC Genesis • Situation • Bias towards Financial Measures • Initiatives not all linkable to financials, hence • Either not undertaken • Or too many initiatives • Top Management need to focus • The ‘Balanced Scorecard’ solution - Kaplan & Norton • A set of measures based on • Finance • Customers • Internal processes • Learning and growth • Linked to vision and strategy • ‘Balances’ short and long term needs • Builds ‘leading’ and ‘lagging’ indicators
BSC Elements Finance Customer Vision & Strategy Internal Processes Learning & Growth
Finance To succeed financially, how should we appear to our shareholders? • Financial measures • Show economic consequences of actions already taken • Show if strategy implementation has given results • Typical measures: • Revenue • Gross Profit • ROI • EVA
Customers To achieve our vision, how should we appear to our customers? • Measures typically can be related to: • Customer satisfaction • Customer retention • New customer acquisition • Value delivery - to customer • Market and account share in targeted segments • Segment specific drivers could be: • Shorter lead times • Innovative products and services • Better quality
Internal Processes To satisfy our shareholders and customers, what business processes must we excel at? • Define key business processes • Business process analysis • Business process reengineering • Typical measures: • Time to complete a service • Decrease of the total cost of the process
Learning and Growth To achieve our vision, how will we sustain our ability to change and improve? • Employees skills and competences • Current • Needed for the future • Typical measures: • Self Assessment • Certification
Cause/Effect Relationship EVA Finance Customer Loyalty Customer On-time delivery Process Quality Process Cycle time Internal Processes Employee Skills Learning and Growth
Sears Employee-Customer-Profit Chain A COMPELLING PLACE TO INVEST A COMPELLING PLACE TO SHOP A COMPELLING PLACE TO WORK Customer recommendations The rectangles represent survey information, the ovals hard data Attitude about the job Service helpfulness Return on assets Operating marginRevenue growth Employee behaviour Customer impressions Attitude about the company Merchandise value Employee retention Customer retention DRIVES DRIVES 5 unit increase in 1.3 unit increase in 0.5% increase in employee attitude customer impression revenue growth
Hypothetical Model Employee Attitudes Customer Attitudes Business Performance • Satisfaction • Loyalty • Recommendation • Spending intention • Retention • Sales volume growth • Profitability • Added value per head • Return on capital • Productivity • Job satisfaction • Commitment • Service climate • Training • Resources • Culture • Line mgmt
Why ‘Balanced?’ • A focus only on financial measures is backward looking and restrictive • Companies have several key stakeholders - not just shareholders, but customers and employees • Measures should look to the future as well as the past and the present
Kaplan & Norton Original Vision and Strategy Initiatives Initiatives Initiatives Initiatives Objectives Objectives Objectives Measurers Measurers Measurers Measurers Tangles Tangles Tangles Tangles Objectives Financial “To succeed financially, how should we appear to our shareholders?” Customer Internal Business Process “To satisfy our shareholders and customers, what business processes must we excel at?” “To achieve our vision, how should we appear to our customers?” Learning and Growth “
BSC Use • Translating strategy into operational terms • Communicating strategy and targets • Monitoring direction and progress • Reporting to stakeholders • Changing behaviour • Enabling double loop learning
Possible Limitations • Does it have to be 4 quadrants? Don’t be constrained by the format! • Are employees adequately represented? Learning, growth, positive and forward-looking concepts, but what about commitment, attitudes, motivation? • Designed primarily for the private sector
Public Sector Differences - 1 • Focus on cash limit rather than profit • Funded by taxation and/or charges that are centrally fixed • No shareholders • Regional or national focus rather than global
Public Sector Differences - 2 • Political influence • Requirement to respond to ‘central’ initiatives • Stakeholders are different or have a different emphasis • Concept of accountability • Ethos of public service
Public Sector Stakeholders • Customers of services • Employees • Taxpayers • Voters • Wider public • The Government
Public Sector Tensions • Cost versus quality • Freedom versus regulation • Spending constraints versus public demand • Organisational wishes versus political direction
Barriers • Understanding the rules • Data collection issues • Organisational politics • Time • Expertise
Strategy Description • Strategic Map • Perspectives • Objectives of the organization
Initiatives What do we need to do to realize the objectives?
The Link http://obs.is-bg.net Username: public Password: welcome
Strategic Management Management information system for e-government monitoring and strategic management based on the Balanced Scorecard methodology
Bulgarian eGovernment % of basic public services for Citizens and Businesses, available online 2003 – Actual Citizens – 47.17 % Businesses – 34.32 % 2004 – Planned Citizens – 68.03 % Businesses – 77.83 % 2005 – Planned Citizens – 100 % Businesses – 100 %
Up-to-Date Achievements Best scores and maximum result for: • Job search services • by labour offices – 100 % • Declaration to the • police – 100 % • Public libraries – 100 % • Social security • contributions – 75 %
Functional Advantages • Several view-points • User-friendly, web-based interface • Cause-and-effect relationship • Quantitative measurement by key performance indicators • Multidimensional analyses • Qualitative assessment • Feedback and communication
Information System Design BSC Strategic Process eGov MIS Conceptual model Data Collection Process
Technological Background Architect Metadata Manager Loader Create Tables Input Dimension Fields in Master Tables Master Tables Fields in Dimensions Input Tables Real & Plan data Populate tables Base Tables Real & Plan data System Tables Real & Plan data • OLAP cube for each measure provides • analyses across different dimensions
KamenSpassov Coordination Center for Information Communication and Management Technologies kspassov@ccit.government.bg Thank You!