Download
1 / 23
230 likes | 310 Views
Explore sampling distributions, point estimators, unbiasedness, and the Central Limit Theorem in statistics. Learn to compute sample means, errors, and medians. Dive into key concepts and examples.

E N D
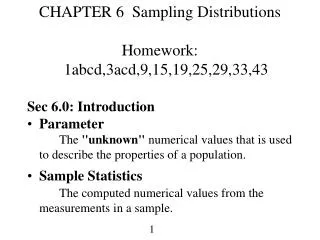
CHAPTER 6 Sampling Distributions Homework: 1abcd,3acd,9,15,19,25,29,33,43 Sec 6.0: Introduction • Parameter The "unknown" numerical values that is used to describe the properties of a population. • Sample Statistics The computed numerical values from the measurements in a sample.
Sec 6.1: What is a Sampling Distribution? • Sampling Error The error results from using a sample instead of censusing the population to estimate a population quantity. • Sampling Distributions The sample statistics vary from one sample to another. Therefore, there is a distribution function associated with each sampling statistic. This is called the sampling distribution.
Example 6.1: The three most popular numbers which were picked up by a group of students are 7, 17, and 24. Assume that the population mean and standard deviation are 16 and 8, respectively. (a). List all the possible samples of two numbers that can be obtained from this three numbers. (b). Find the sample mean for each sample. (c). Compute the sample error for each sample. (Solutions in the note page)
Example 6.2 (Basic) The population of average points per game (ppg) for the top five players of Orlando Magic is presented in the following table. (First eight games in 1996 playoff) Player ppg O'Neal(O) 25.3 Anderson(A) 16.4 Grant(G) 16.9 Hardaway(H) 22.3 Scott(S) 13.4 (a) Find the sampling distribution of the mean of the "ppg" of three players from the population of five players. (Part (a) solution is in note page)
Example 6.2 Continue: (b) Compute the mean and standard deviation of the sample mean. <Solution to part (b)>: Note: If you forget how to do it, you need to review Chapter 4.
Example 6.2 Continue: (c) Find the sampling distribution of the sample median of the "ppg" of three players from the population of five players. (solution in note page) (d) Compute the mean and mean square error of the sample median. <Solution to part (d)>:
Sec 6.2: Some Criterions for choosing a Statistics • Point Estimator A point estimator of a population parameter is a rule that tell us how to obtain a single number based on the sample data. The resulting number is called a point estimator of this unknown population parameter.
Unbiasedness The mean of the sampling distribution of a statistic is called the expectation of this statistic. If the expectation of a statistics is equal to the population parameter this statistics is intended to estimate, then the statistics is called an unbiased estimator of this population parameter. If the expectation of a statistics is not equal to the population parameter, the statistics is a biased estimator.
NOTES: (1). If the population is normally distributed and the sample are randomly selected from this population, the sample mean is the best unbiased estimator of the population mean. (2). If the population has an extremely skewed distribution and the sample size of the random sample is small, the sample mean may not be best estimator of the population mean.
Example 6.3: Consider the probability distribution shown here. x p(x) 2 1/3 4 1/3 9 1/3 (a) Find m. <Solution to (a)>:
Example 6.3 Continue: (b)List all possible samples of three observations. <solution for part (b)>: (2,2,2) (2,,2,4) (2,4,2) (4,2,2) (2,4,4) (4,2,4) (4,4,2) (4,4,4) (2,2,9) (2,9,2) (9,2,2) (2,4,9) (2,9,4) (4,2,9) (4,9,2) (9,2,4) (9,4,2) (4,4,9) (4,9,4) (9,4,4) (2,9,9) (9,2,9) (9,9,2) (4,9,9) (9,4,9) (9,9,4) (9,9,9)
Example 6.3 Continue: (c) For a sample of 3 observations, find the sampling distribution of the sample mean and its mean value <Solution to part (c)>: mean P(mean) 2 1/27 8/3 3/27 10/3 3/27 4 1/27 13/3 3/27 5 6/27 17/3 3/27 20/3 3/27 22/3 3/27 9 1/27
Example 6.3 Continue: (d) For a sample of 3 observations, find the sampling distribution of the sample median and E(median). <Solution to part (d)>: median P(median) 2 7/27 4 13/27 9 7/27 E(median) = Smedian * P(median) = 2 * 7/27 + 4*13/27 + 9*7/27 = 14.33
Sec 6.3: Central Limit Theorem Some properties of the sample mean (1). The expectation of the sampling distribution of is equal to the population mean m, i.e. (2). The sampling distribution of sample mean is approximately normal for sufficiently large sample size even if the sampled population is not normally distributed. (3). The sampling distribution of sample mean is exactly normal if the sampled population is normally distributed no matter how small the sample size is.
Central Limiting Theorem Suppose a random sample of size n is drawn from a population. If the sample size n is sufficiently large, then the sample mean has at least approximately a normal distribution. The mean value of the sample mean is always equal to the population mean, and the standard error of the sample mean is always equal to where s is the population standard deviation.
Note: Each of the following figure shows the population distribution (n=1) and three sampling distributions of the sample mean for different populations. We can see that the sampling distribution of the sample mean is approximately normal distributed when the sample size getting larger.
Figure 6.1 Normal Population 2.0 2.0 f(x) f(x) 1.0 1.0 0.0 0.0 -4 -2 0 2 4 -4 -2 0 2 4 n = 1 n = 2 2.0 2.0 f(x) f(x) 1.0 1.0 0.0 0.0 -4 -2 0 2 4 -4 -2 0 2 4 n = 4 n = 30
Figure 6.2 Chi-Square Population 2.0 2.0 f(x) f(x) 1.0 1.0 0.0 0.0 0.0 0.5 1.0 1.5 2.0 2.5 3.0 0.0 0.5 1.0 1.5 2.0 2.5 3.0 n = 1 n = 2 2.0 2.0 f(x) f(x) 1.0 1.0 0.0 0.0 0.0 0.5 1.0 1.5 2.0 2.5 3.0 0.0 0.5 1.0 1.5 2.0 2.5 3.0 n = 4 n = 30
Figure 6.1 Uniform Population 8 8 6 6 f(x) 4 f(x) 4 2 2 0 0 0.0 0.2 0.4 0.6 0.8 1.0 0.0 0.2 0.4 0.6 0.8 1.0 n = 1 n = 2 8 8 6 6 f(x) 4 f(x) 4 2 2 0 0 0.0 0.2 0.4 0.6 0.8 1.0 0.0 0.2 0.4 0.6 0.8 1.0 n = 4 n = 30
Example 6.4: Suppose that you selected a random sample of size 4 from a normal population with mean 8 and standard deviation 2. (a) Is the sample mean normally distributed? Explain. (b) Find P( > 10). (c) Find P( < 7).
<Solutions to EX 6.4>: (a) Yes. The sampling distribution of sample mean is exactly normal if the sampled population is normally distributed no matter how small the sample size is. standard error = (b) P(x > 10) = = P(z > 2) = 0.0228 (c) P(x < 7) = = P(z < -1) = 0.1587.
Example 6.5: As reported in the National Center for Health Statistics, males who are six feet tall and between 18 and 24 years old have a mean weight of 175 pounds with a 14 pound standard deviation. (a). Find the probability that a random sample of 196 males who are six feet tall and between 18 and 24 years of age has a mean weight greater than 176 pounds. (b). Find the probability that a random sample of 4 males who are six feet tall and between 18 and 24 years of age has a mean weight greater than 168 pounds. State the necessary assumptions.
<Solutions to EX 6.5>: (a) standard error = P( x > 176) = = P( z > 1) = 0.1587 (b) standard error = P( x > 168) = = P( z > -1) = 0.8413. The population needs to have normal distribution.