Download
1 / 18
180 likes | 531 Views
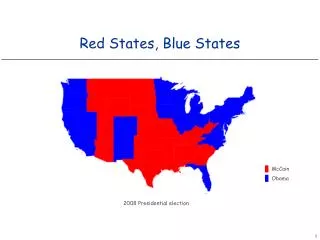
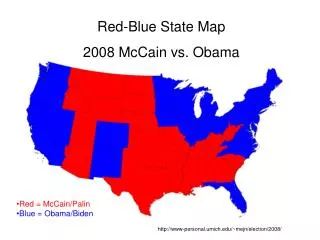
Red-Blue State Map 2008 McCain vs. Obama. Red = McCain/Palin Blue = Obama/Biden. http://www-personal.umich.edu/~mejn/election/2008/. Red-Blue State Cartogram 2008 McCain vs. Obama. Red = McCain/Palin Blue = Obama/Biden. http://www-personal.umich.edu/~mejn/election/2008/.

E N D
Red-Blue State Map 2008 McCain vs. Obama • Red = McCain/Palin • Blue = Obama/Biden http://www-personal.umich.edu/~mejn/election/2008/
Red-Blue State Cartogram 2008 McCain vs. Obama • Red = McCain/Palin • Blue = Obama/Biden http://www-personal.umich.edu/~mejn/election/2008/
Red-Blue County Map 2008 McCain vs. Obama • Red = McCain/Palin • Blue = Obama/Biden http://www-personal.umich.edu/~mejn/election/2008/
Red-Blue County Cartogram 2008 McCain vs. Obama • Red = McCain/Palin • Blue = Obama/Biden http://www-personal.umich.edu/~mejn/election/2008/
Red-Blue Blend County Map 2008 McCain vs. Obama • Red = McCain/Palin • Blue = Obama/Biden http://www-personal.umich.edu/~mejn/election/2008/
Election Results by State 2000 Actual Vote Bush: 50,456,002 or 47.87% Gore-50,999,897 or 48.38% http://www.fec.gov
World http://www-personal.umich.edu/~mejn/cartograms/
People Living With HIV http://www-personal.umich.edu/~mejn/cartograms/
World Energy Consumption http://www-personal.umich.edu/~mejn/cartograms/
HIV Rates Child Mortality Rates World Population Healthcare What inferences can you draw from the cartograms above? http://www-personal.umich.edu/~mejn/cartograms/
Healthcare World Energy Consumption Greenhouse Gases Gross Domestic Product (GDP) What inferences can you draw from the cartograms above? http://www-personal.umich.edu/~mejn/cartograms/