Download
1 / 16
160 likes | 250 Views
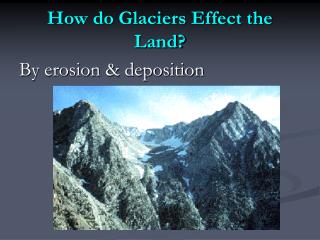
Explore the representativeness of benchmark glaciers in the South Cascade Glacier region compared to other index glaciers in Alaska and the Continental US. Analysis of topographic characteristics, area changes, and mass balance variations.

E N D
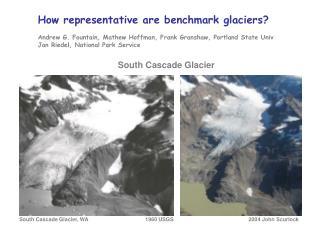
South Cascade Glacier, WA 1960 USGS 2004 John Scurlock How representative are benchmark glaciers? Andrew G. Fountain, Mathew Hoffman, Frank Granshaw, Portland State Univ Jon Riedel, National Park Service South Cascade Glacier
Benchmark Glaciers of the US Alaska Gulkana -- Alaska Range Wolverine -- Kenai Range Continental US South Cascade -- Cascade and Olympic ranges of Washington and Oregon Our report here on the region around South Cascade Glacier Meier, 1985
Dome Peak John Scurlock
Methods Historic Maps Aerial Photos Repeat Photography Gridded Climate Data Glacier Inventory (24K) GIS Database Lyell Glacier www.glaciers.us
Park Complex • South Cascade Glacier • Original IHD glacier • Monitored since 1959 • US Geological Survey • Mass & Water Balance • 4 Index Glaciers • Monitored since 1992 • Nat. Park Service • Mass balance only • 316 Remotely-sensed • 1958, 1998 • Area only
What is a representative glacier? • Topographic characteristics? • area slope • elevation aspect • Location? (any glacier will do) • Similar climatic response? Pugh Glacier John Scurlock
Topographic Characteristics 100% 90% 80% 70% 60% Fraction of glaciers smaller 50% 40% 30% 20% 10% 0% 0 1 2 3 4 5 6 7 Benchmark Glacier Index Glaciers 1998 Area (km2) Glacier Area
Topographic Characteristics 3000 Elevation, Area, Slope 2500 3000 2000 2500 Mean Elevation (m) 2000 1500 Mean Elevation (m) 1500 1000 Benchmark Glacier 1000 Index Glaciers 500 Remotely Sensed Glaciers 500 0 0 2 4 6 0 Area (km2) 0 20 40 60 80 Mean Slope (deg)
Area Changes Number of Glaciers and Area Change 10% 0% -10% -20% -30% -40% -50% -60% -70% Fractional Area Change
Area Changes Uncertainty
From this cursory analysis, both • topographic characteristics • area change • suggest that the benchmark glacier is not representative of the region. And the other index glaciers may be better. • Furthermore, the use of the benchmark glacier would over estimate the glacier change in this region. John Scurlock
) Mass Balance Variations
Mass Balance Variations Cummulative Mass Change ( m weq)
Conclusions • If the example from the North Cascades is typical, probably most benchmark glaciers are not rep- resentative of the regional glaciers, due to the necessary selection criteria (IHD). - different topographic characteristics - different area/volume changes • Year to year variations in net mass balance are well represented (probably by any glacier). But small differences between glaciers yield large cummulative differences. • The issue is how to transfer mass balance variations from one glacier to another to more accurately depict variations across the region.