Download
1 / 25
250 likes | 373 Views
Introduction What can be learned directly from the data? Fancier analysis methods The Big Question: How well can HITf/x predict landing point? hang time? full trajectory?. Combining HITf/x with Landing Point Alan Nathan, Univ. of Illinois. Why do we care?. HITf/x data come for “free”

E N D
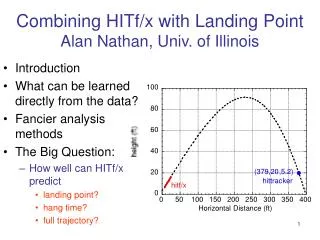
Introduction What can be learned directly from the data? Fancier analysis methods The Big Question: How well can HITf/x predict landing point? hang time? full trajectory? Combining HITf/x with Landing Point Alan Nathan, Univ. of Illinois
Why do we care? • HITf/x data come for “free” • If HITf/x can determine full trajectory, then we have a handle on • Hang time • Fielder range and reaction time • Outcome-independent hitting metrics • Accurate spray charts • …..
My approach to studying the problem • Get initial trajectory from HITf/x • Get landing point and flight time from hittrackeronline.com • thanks to Greg Rybarczyk C. Determine how well A determines B
The physics issues • If we know the initial conditions (HITf/x) and we know all the forces, then we can predict the full trajectory. • What are the forces and how well are they known?
FMagnus Fdrag mg What are the Forces? • Gravity • Drag (“air resistance”) • Magnus Force (due to spin) • Drag and Magnus depend on air density, wind • Drag depends on “drag coefficient” Cd • Magnus depends on spin • backspin b: upward force • sidespin s: sideways force
What can be learned directly from the data? • characteristics of home runs • effect of sidespin • effect of backspin • effect of drag and spin on fly ball distance --does a ball “carry” better in some ball parks than in others? --is there a “Yankee Stadium” effect?
How important is SOB? each additional mph of SOB increases range by ~4 ft
What is optimum launch angle for home runs? normalized range = range/(k*v0) approximately 300
sideways break sidespin (s) f i RF foul line 1B i- f measures sideways break
Effect of Sidespin CF LF RF RHH break to right break to left LHH • balls breaks towards foul pole • amount of break increases with spray angle • balls hit to CF seem to slice • the slice results in asymmetry between RHH and LHH
backspin increase hang time drag decreases hang time ratio of hang time to vacuum value approaches 1 with larger launch angle Hang Time:ratio to vacuum value
D D0 Effect of Drag and Lift on Range R = actual distance/vacuum distance = D/D0 = 379/532 = 0.71
best carry: Houston, Denver worst carry: Cleveland, Detroit, Oakland best-worst: 10% or about 40 ft
Does the ball carry better in Yankee Stadium? No evidence for better carry in the present data. Coors YS
Home Run Spray Chart CF LF RF
Fancier Analysis Methods • There are things we don’t know well • the spin on the batted ball (b and s) • the drag coefficient Cd • Therefore, we will use the actual data as a way to constrain b, s, Cd • develop relationships between these quantities and initial velocity vector • investigate how well these relationships reproduce the landing point data.
for given hitf/x initial conditions, adjust Cd, b, s to reproduce landing point (x,y,z) at the measured flight time • unique solution is always possible • --flight time determines b • --horizontal distance and flight time determines Cd • --sideways deflection determines s
R-D R-D fall fall H H How Far Did That Ball Travel? • How to extrapolate from D to R • Compare angle of fall to launch angle tan(fall)=H/(R-D) D R
fall fall/ R fall/ = 1.4
Sidespin s (rpm) LHH LHH (deg) (deg)
Backspin b (rpm) (deg) b (rpm) (deg)
Summary • we have expressions for b() and s() • there is lots of scatter of the data about these mean values • Is the scatter real? • that means we still have a ways to go to meet our goal of predicting landing point and hang time from HITf/x data alone • but we have learned some things along the way • Optimum launch angle for home run • Importance of SOB: 4 ft/mph • L-R asymmetry in s • characterization of “carry” • look forward to landing data from hit balls other than home runs