Download
1 / 30
300 likes | 405 Views
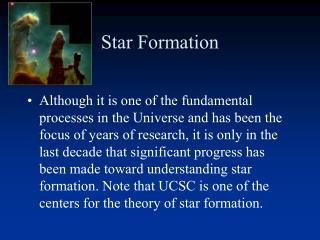
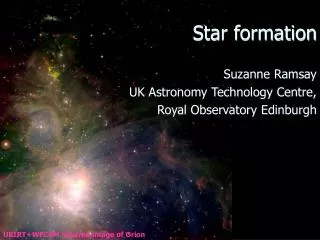
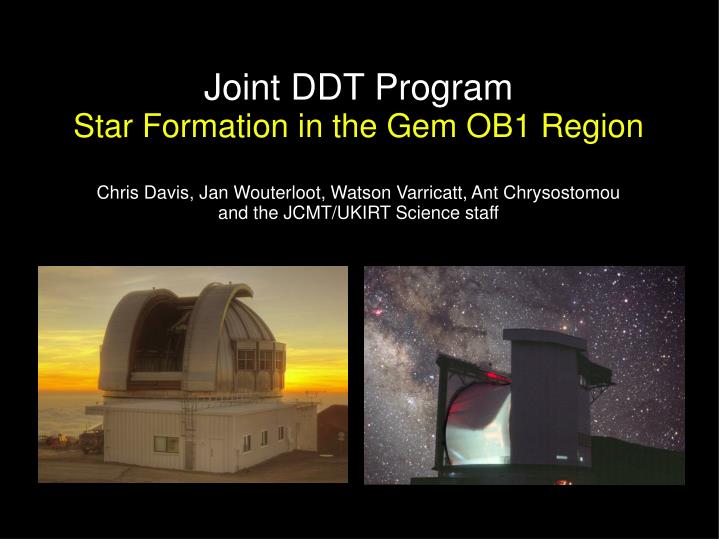
Joint DDT Program Star Formation in the Gem OB1 Region. Chris Davis, Jan Wouterloot, Watson Varricatt, Ant Chrysostomou and the JCMT/UKIRT Science staff. Molecular Clouds in Gemini Second/Third Galactic Quadrant : l ~ 190 degs (Galactic Anti-Centre) 13 CO J = 1-0 survey

E N D
Joint DDT ProgramStar Formation in the Gem OB1 Region Chris Davis, Jan Wouterloot, Watson Varricatt, Ant Chrysostomou and the JCMT/UKIRT Science staff
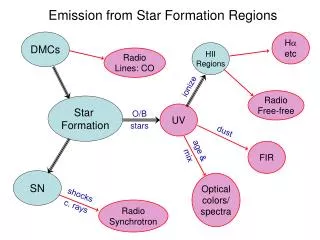
Molecular Clouds in Gemini Second/Third Galactic Quadrant: l ~ 190 degs (Galactic Anti-Centre) 13CO J = 1-0 survey (170 < l < 196 degs) by Kawamura et al. (1998) with a 3’ beam. CO J = 1-0 mapping with FCRAO with an angular resolution of about 50” (Carpenter et al. 1995) 13CO contours (Kawamura et al. 1998) Crosses mark locations of early type stars - the OB associations - catalogued by Humphreys (1978)
Molecular Clouds in Gemini Clouds associated with the Orion Spur or Perseus Arm? Star formation at ~ 300pc and ~ 2 kpc Studying clouds with large galacto-centric distances… 13CO contours (Kawamura et al. 1998) Crosses mark locations of early type stars - the OB associations - catalogued by Humphreys (1978)
Existing Complementary Data: Near-IR: UKIDSS GPS JHK data available (WFCAM) Mid-IR: Some Spitzer data are available in PI projects (but also GLIMPSE360 - 3.6um and 4.5um) Far-IR: Herschel data will eventually be available (Hi-GAL360, 5-band PACS and SPIRE) Sub-mm: not covered by Gould Belt Survey, but is part of JPS (SCUBA-2) MSX A MSX A
How can we complement these existing/proposed observations? Joint UKIRT/JCMT Project CO 3-2 mapping with Harp/JCMT H2 (and K band) imaging with WFCAM/UKIRT can
Infrared “Finders” Firstly we imaged the clouds along the plane with WFCAM… Each square represents a “WFCAM Tile” (covering 0.8 sqr degrees) WFCAM - 0.4” pixels K >18th mag point sources detectable in a few minutes (broad band) or ~10 mins narrow band)
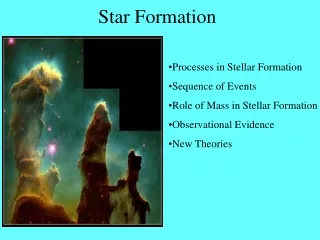
Scientific Goals of the Project 1. Map star formation on global scales, across a number of independent regions and GMCs in the outer galaxy 2. Trace jets and outflows in the near-IR (H2) and the Sub-mm (CO 3-2) 3. Identify (Spitzer) protostars from their association with outflows 4. Identify proto-stellar cores from their association with outflows 5. With combined UKIRT/Spitzer/JCMT/Herschel data, build up a census of prestellar cores, protostellar cores, and T Tauri stars (no molecular flow) 6. Establish prestellar/protostellar ratio, lifetimes, etc… - Star formation efficiency - Star formation rate
Tile A 1’
Tile B 1’
Tile B 1’
Tile E 1’
JCMT ObsLarger, shallow maps:CO 3-2 - 1000 MHz bandwidth - 488 kHz/0.4 km/s resoln - 0.1 sec sample time - 3/4 array step - basket weaveSmall, deep maps:CO 3-2 and H13CN 4-3 - 250 MHz bandwidth - 61 kHz/0.05 km/s resoln - 1 sec sample time - 1/4 array step - basket weave (some map pairs repeated with 15” offset). Small maps Tile A: A-CenA 06:08:43.0 +21:31:06 6’ x 6' A-Na 06:08:52.0 +21:38:09 7’ x 6' A-Nb 06:08:32.0 +21:40:51 3’ x 3' (weak) A-S 06:09:26.0 +21:23:30 5’ x 3' (weak) A-NE 06:09:52.0 +21:38:26 4’ x 3' (weak) Tile B: B 06:08:58.0 +20:39:10 21’ x 9' B-S 06:09:53.0 +20:32:50 9’ x 9' B-W 06:07:47.0 +20:39:36 3’ x 3' (weak) B-ano 06:09:08.0 +20:28:00 5’ x 5' (weak) Tile D: D-NE 06:14:54.0 +19:01:40 9'x5' Tile E: E-Cen 06:14:24.0 +17:44:30 12’ x 7' E-W 06:13:57.0 +17:50:28 4’ x 3' (weak) E-NW 06:13:45.0 +17:55:20 3’ x 3' (weak) Tile F: F-Cen 06:12:58.0 +17:57:44 20’ x 11'
Tile B - Fast Map CO 3-2 integrated Map size: ~ 55 x 55 arcmin
TILE A AFGL 5180 AFGL 6366 CO 3-2 integrated intensity
AFGL 5180 TILE B Sh 2-252 A AFGL 5183 AFGL 6366 CO 3-2 integrated intensity
AFGL 5180 Sh 2-255B TILE F Sh 2-255 AFGL 6366 TILE E CO 3-2 integrated intensity
CO 3-2 data quality… Large, shallow maps - 0.4 km/s resolution : 0.6-1.2 K in most regions (as high as 1.8 K in some parts of Tile A, and up to 3.0 K in parts of Tile E) Small, deeper maps - 0.05 km/s resolution: 0.6-0.9 K in almost all regions (more even depth) We are currently focusing on Tile E
Tile E H2-K image Outflows Identified independently by manually scanning through PV diagrams (binned to 0.55 km/s resolution)
Tile E Outflow #19
Tile E H2-K image Bipolar Outflow #3 and 5
Not all CO flows are seen in H2 emission ! Tile E Outflow #11 H2-K image
Antonio’s Outflow Extraction Algorythm! Calculates moments V and sigma from average spectra (excluding brightest spectra) and integrates between 2 and 15 sigma either side of this average V. Remo also has a script! Color-composite of red-shifted, ambient (green) and blue-shifted CO HV Red- and Blue-shifted contours on “ambient velocity” CO image
Antonio’s Outflow Extraction Algorythm! H2-K Image HV CO contours
H2-K Image SCUBA contours SCUBA 850 micron contours (Di Francesco et al. - SCUBA archive paper) Plenty of dust emission … “protostellar” cores clearly related to outflows
Final Remarks 1. We have identified a very interesting region. 2. Complementary data are available in abundance. 3. The DDT project doesn’t “tread on the toes” of exisiting surveys. 4. Possibility for a number of “stand alone” papers (examining individual regions) and/or an “overview” paper comparing these seemingly similar sites of clustered star formation. 5. JCMT and UKIRT scientists are now collaborating (best chums) ! 6. …
Tile B Thank You Spitzer - IRAC 3.6/4.5/5.8 micron