Download
1 / 69
690 likes | 751 Views
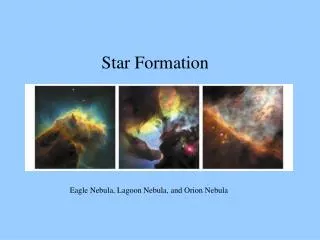
Explore the dynamics and impact of star formation in galaxies through cutting-edge observations and surveys. Unravel the mysteries of cosmic evolution and the crucial role of star formation. Join us for lectures on diagnostics, demographics, and more.

E N D
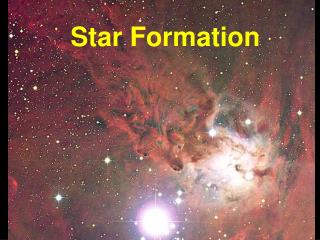
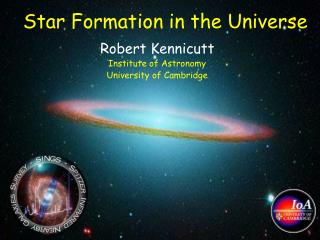
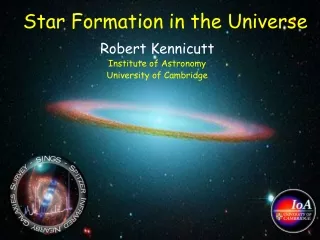
Star Formation in the Universe Robert Kennicutt Institute of Astronomy University of Cambridge
Lectures 1. Diagnostics of Star Formation Rates 2. Demographics of Star-Forming Galaxies and Starbursts (Mon 1pm) 3. Nearby Galaxies as Revealed by the Spitzer Space Telescope (colloquium – Tues 4:15pm) 4. The Star Formation Law (next Thurs 1pm)
Motivations • Observations of external galaxies reveal global and local star formation events ranging over >107x in absolute scale--- over a far wider range of physical environments than can be found in the Milky Way • Star formation is a primary component of galaxy evolution and cosmic evolution • Despite its central role, galactic-scale SF as a physical process is barely understood
Contributions to the Global Star Formation Budget IR-luminous: ~5-8% circumnuclear: ~3-4% BCGs, ELGs: ~5-8% Total fraction ~10-20%
An Information Explosion • advent of the mega-survey • SDSS, 2DF --> imaging, spectra for >>106 galaxies to z=0.5 • GALEX • SFRs for 107 galaxies to z>1 • ~10000 galaxies within 70 Mpc • Spitzer • 3 Legacy surveys + MIPS/IRS GTO starburst survey • large Ha surveys • SFR maps for >4000 galaxies • ISM surveys • e.g., WHISP, THINGS, BIMA SONG --> ALMA, Herschel
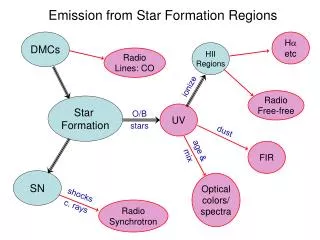
Multi-Wavelength SFR Diagnostics `calorimetric’ IR (m) 1 10 100 1000 24 m 70 m 160 m 8 m [OII] P H UV Dale et al. 2007, ApJ, 655, 863
GALEX FUV + NUV (1500/2500 A) Ha + R IRAC 8.0 mm MIPS 24 mm
Spitzer Infrared Nearby Galaxies Survey (SINGS) • complete IRAC, MIPS imaging of 75 nearby galaxies (3.5 – 160 mm) • IRS, MIPS radial strip maps (10 – 100 mm) • IRS maps of centers, 75 extranuclear sources (5–37 mm) • ancillary imaging campaign covering UV to radio Kennicutt et al. 2003, PASP, 115, 928
Ultraviolet stellar continuum: key advantages • direct photospheric measure of young massive stars • primary groundbased SFR tracer for galaxies at z>2 • However: • heavily attenuated by dust. Dust `correction’ methods have limits (age-dust degeneracy). • dependent on the stellar population mix, usually measures timescales of ~100 Myr. Dale et al. 2007, ApJ, 655, 863
GALEX Mission - all-sky survey - 5 arcsec resolution - 1500 A, 2500 A to AB = 20-21 - 10,000 galaxies to z=0.02 - deep surveys to AB = 25.5, 26.5 - launched April 2003
Steidel et al. 1996, ApJ, 462, L17
Building an Evolutionary Synthesis Model + Kurucz 1979, ApJS, 40, 1 single star SED evolution model Maeder, Meynet 1988, A&AS, 76, 411
“single burst models” “continuous star formation” models (single age star clusters) Leitherer et al. 1999, ApJS, 123, 3 “Starburst99”
apply evolutionary synthesis maodels to constrain IMF Kennicutt, Tamblyn, Congdon 1994, ApJ, 435, 22
UV, Dust, and Age 26 Starbursts A dusty stellar population may have similar UV characteristics of an old population (Calzetti et al. 1994,1995,1996,1997,2000, Meurer et al. 1999, Goldader et al. 2002)
Blue= starbursts Red= normal SF 26
M51Calzetti et al. 2005, ApJ, 633, 871 FUV,Ha, 24mm 3.6,4.5,5.8, 8.0mm
Photoionization Methods: Emission Lines • for ionization-bounded region observed recombination line flux scales with ionization rate • ionization dominated by massive stars (M > 10 Mo), so nebular emission traces SFR in last 3-5 Myr • ionizing UV reprocessed through few nebular lines, detectable to large distances • only traces massive SFR, total rates sensitive to IMF extrapolation • SFRs subject to systematic errors from extinction, escape of ionizing radiation from galaxy SINGG survey, G. Meurer et al. (NOAO)
Local Ha Surveys Survey Ngal Selection PI GOLDMine 277 magnitude Coma/VirgoG. Gavazzi MOSAIC ~1000 HaAbell clustersR. Kennicutt HaGS 450 mag/volume field (<40 Mpc)P. James SINGG/SUNGG*468 HIPASS field (<40 Mpc)G. Meurer STARFORM 150 volume field (<25 Mpc)S. Hameed 11HUGS ***470 volume field (<11 Mpc)R. Kennicutt AMIGA ~270 magnitude isolatedfieldL. Montenegro SINGS ***75 multi-param<30 Mpc R. Kennicutt SMUDGES ~1000 mag field dwarfs L. van Zee UCM 376 objprism field J. Gallego KISS ~2200obj prismfield J. Salzer ** paired GALEX survey
Photoionization Methods: Emission Lines • for ionization-bounded region observed recombination line flux scales with ionization rate • ionization dominated by massive stars (M > 10 Mo), so nebular emission traces SFR in last 3-5 Myr • ionizing UV reprocessed through few nebular lines, detectable to large distances • only traces massive SFR, total rates sensitive to IMF extrapolation • SFRs subject to systematic errors from extinction, escape of ionizing radiation from galaxy SINGG survey, G. Meurer et al. (NOAO)
Leakage of Ionizing Flux at z ~ 3 Shapley et al. 2006, ApJ, 651, 688
composite spectrum Shapley et al. 2006, ApJ, 651, 688
galaxies (integrated fluxes) HII regions Calzetti et al., ApJ, submitted Kennicutt & Moustakas, in prep
Other Emission Lines • - Hb (0.48 mm) • - Paschen-a (1.9 mm) • - Brackett-g (2.2 mm) • - [OII] (0.37 mm) • - Lyman-a (0.12 mm) Scoville et al. 2000, AJ, 122, 3017
11 Mpc Ha/Ultraviolet Survey (11HUGS) SINGG: Survey for Ionization in Neutral-Gas Galaxies SINGG: Survey for Ionization in Neutral-Gas Galaxies M83 = NGC 5236 (Sc)
Lecture 1 Ended Here Extra Slides Follow
Dust Emission • Interstellar dust absorbs ~50% of starlight in galaxies, re-radiates in thermal infrared (3–1000 mm) • Provides near-bolometric measure of SFR in dusty starbursts, where absorbed fraction ~100% • Largest systematic errors from non-absorbed star formation and dust heated by older stars • Different components of IR trace distinct dust species and stellar sub-populations
FIR observations probe the most luminous star-forming galaxies, with SFR >> SFR* (>>10 Mo/yr at present epoch). Martin et al. 2005, ApJ, 619, L59
NGC 628 (M74) C. Tremonti
MIPS 24 mm Gordon et al. 2004, ApJS, 154, 215
FIR to SFR? Dale et al. 2007 `calorimetric’ IR (m) 1 10 100 1000 24 m 70 m 160 m 8 m FIR - sensitive to heating from old stellar populations 8 m - mostly single photon heating (PAH emission) 24 m - both thermal and single photon heating 70 m and 160 m - mostly thermal, also from old stars
SFR (FIR) • Idea around since IRAS times (e.g., Lonsdale & Helou 1987): SFRs from bolometric IR emission • Depending on luminosity, bolometric IR may be measuring star formation or old stars’ heating • FIR SEDs depend on dust temperature (stellar field intensity; Helou 1986); problematic if wavelength coverage is not complete. Higher SFR (stellar radiation field intensity) ~ higher dust `temperature’