Download
1 / 24
240 likes | 430 Views
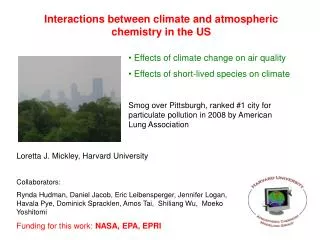
Atmospheric Chemistry and the Climate System. Martin G. Schultz, Thomas Diehl, Claire Granier, Judith Hölzemann, Shyam Lal, Bärbel Langmann, Ulrike Niemeier, Sebastian Rast Max Planck Institute for Meteorology, Hamburg. Scientific Advisory Committee Meeting, November 25-26, 2002.

E N D
Atmospheric Chemistryand the Climate System Martin G. Schultz, Thomas Diehl, Claire Granier, Judith Hölzemann, Shyam Lal, Bärbel Langmann, Ulrike Niemeier, Sebastian Rast Max Planck Institute for Meteorology, Hamburg Scientific Advisory Committee Meeting, November 25-26, 2002
Strat.-trop. Exchange Deposition of HNO3, NOx, SO2, ozone Lightning NOx Prod. Altitude Emissions of DMS, VOCs, NOx, CO, ... Aerosol-Cloud Interactions Ozone + Particles Eutrophication, Fertilization, Acidification Absorption and Scattering of Radiation Reaction Rates Transport pathways Scavenging Rates Release of ozone and sulfate precursor species Feedbacks Chemistry Climate
CO CH4 O3 VOC ? NOx The oxidizing capacity of the atmosphere - Example for a bidirectional feedback OH
Tropospheric Ozone Budgetand Long-range transport of pollution from IPCC 2001
Stratospheric Ozone NO2 OH VOC O2 RO2 NO HO2 Chemistry Dynamics Transport Tropospheric Ozone Temperature Humidity Emissions (NOx, VOC, CO, CH4) Factors controlling the tropospheric ozone budget
Maximum 8-hour mean ozone concentrations at English surface stations Ozone concentrations in maritime air masses at Zugspitze from Scheel et al., 2002 Tropospheric ozone trend Maximum 8-hour mean ozone concentrations at British stations from Eurotrac S&I, 2002
Long-range transport of air pollution:Export from North America
Long-range transport of air pollution:Import into Europe Western Europe Eastern Europe North America East Asia Simulated CO concentrations over Europe, May 2001, ca. 850 hPa
Ozone difference (Sep. 1997-Sep. 1998) -20 -20 -10 -10 -5 -2 -2 2 5 10 20 ppb CO difference (Sep. 1997-Sep. 1998) Interannual variability in transport Changes in transport pathwayslead to significantly differenttrace gas concentrations.Direct effect: different pathway from emission sourcesto receptor region Indirect effect: north-southshift/vertical transport different chemistry(temperature, radiation, humidity) Same emissions, winds from ECMWF
boundary layer flow free trop. transport Conceptual picture of major transport pathways WCB Asia NorthAmerica WCB Europe
Using chemical measurements on aircraft to quantify export and import fluxes • Direct involvement in large-scale field experiments (e.g. NASA TRACE-P, North Pacific, spring 2001; MINOS, Crete, summer 2001) • Modeling support for analysis of other field experiments (e.g. INDOEX, 1998, 1999; CONTRACE, 2001; BIBLE, 1997, 1998)
CO tracer forecasts during TRACE-P before the campaign: planning of flight patterns during the campaign: daily forecasts of CO after the campaign: analysis with tagged CO and full chemistry model Objectives: Determine the chemical composition of the Asian outflow over the western Pacific in spring in order to understand and quantify the export of chemically and radiatively important gases and aerosols, and their precursors, from the Asian continent. Determine the chemical evolution of the Asian outflow over the western Pacific in spring and to understand the ensemble of processes that control this evolution.
altitude observed model Example for model evaluation Comparison of model results along TRACE-P flight track DC-8 for 7 March 2001 (local flight out of Hong Kong)
analysis 18-h forecast 66-h forecast 114-h forecast Evaluating the forecast quality Example for 7 March 2001, 0600 UTC, ca. 850 hPa
Linking global and regional models Effect of time-varying boundary conditions on Ozone concentrations over Germany global model global+regional model regional model Ozone in ppb
Slant column Air mass factor = Vertical column Interpretation of satellite data Use of models to determine airmass factor (dependent on geometry,zenith angle, albedo, ...) Collaboration with Institutefor Remote Sensing, Universityof Bremen
Outlook Objective: to provide a quantitative and consistent description of the global tropospheric budget of ozone Tools: full chemistry model MOZART, ECHAM tagged CO tracer model, and regional model REMO Coordinating EU project: REanalysis of TROpospheric chemical composition over the past 40 years
Biomass burning emissions Significant emission source for many trace gases (and aerosol) Large interannual variability in distribution and magnitude Competition between man-made and natural fires Fire characteristics ecosystem dependent Ecosystems respond to fire Impact of climate change
A new global inventory for biomass burning emissions using satellite observations of burned areas M = EF x A x x afl GLOBSCAR data from ESA/ESRIN
Assessing the variability of biomass burning emissions OCTOBER „Climatology“ Use of active fire counts (ATSR)to scale a climatological emission inventory
Case study 1: Indonesia 1997/1998 Scaled inventory from global model Aerosol simulations from regional model REMO Importance of peat fires! (90% of emissions from Borneo) Severly understimated when using satellite data to estimate emissions
Case Study 2: Sydney, December 2001 AVHRR image 01/01/2002 MODIS AOD average(courtesy A. Chu, NASA) Model simulation (MOZART) in T85L47, ECMWF winds, daily emissionestimates using MODIS fire counts [near-surface CO in ppb]
Outlook Refine of global inventory, extension to multiple years Investigate impact of Indonesian peat fire aerosol on meteorology Analyse role of volcanoes for sulfur content in Indonesian peatfire emissions Contrast Sydney 2001 with Sydney 2002 Develop methods for estimating biomass burning emissions based on meteorological parameters