Download
1 / 38
400 likes | 675 Views
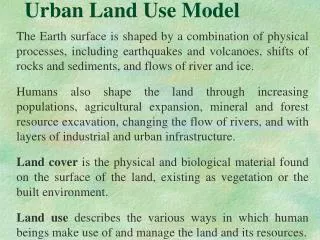
Chapter 6. Urban Land Use: The CBD (downtowns). Monocentric city (up to 1950) Polycentric city (after the development freeways and the “edge cities”) Concepts of centrality and accessibility determine mono and poly-configured metropolitan form. Urban land value “surface”.

E N D
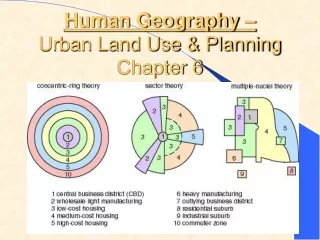
Chapter 6. Urban Land Use: The CBD (downtowns) • Monocentric city (up to 1950) • Polycentric city (after the development freeways and the “edge cities”) • Concepts of centrality and accessibility determine mono and poly-configured metropolitan form
Traditional CBD characteristics • PLVI • CBD “frame”/ “zone in transition” • The old skid rows were located here • Zones of assimilation and discard • Directional movement of the CBD • Daytime/nightime populations • 1950 vs. present
The post-1950 decline of the CBD • Manufacturing is first to close • “just in time” delivery • Train vs. truck transport • Less expensive land on metro edge • Need an abundance of space (horizontalization) • Retailing follows • Establishment of regional suburban malls in early 1970s
Late 70’s and early 80s: the beginings of the downtown renaissance • The Festival Marketplace
Milwaukee’s Grand Ave. Mall
1990s and 2000s • Massive residential conversion • Lofts in the old CBD frame • Old office towers to residential towers • New construction
Who Lives downtown in 2009? • During the 1990s, downtown populations grew by 10%, reversing 20 years of overall decline • Downtown household composition shifted (towards smaller size) • Downtowns have higher % of young adults with college-degrees and empty nesters • The most and least affluent
Rank by pop size in 2000 • 1. Lower Manhattan 97,792 • 2. Midtown Manhattan 71,668 • 3. Boston 80,903 • 4. Philadelphia 78,349 • 5. Chicago 72,843 • 6. San Francisco 43,531 • Average is about 10,000 • Milwaukee = 16,569 • Phoenix = 5,959