Download
1 / 9
90 likes | 108 Views
Variability of Measured and Modeled Remote Sensing Reflectance for Coastal Waters at LEO-15 Sasha Tozzi 1 , Oscar Schofield 1 , Mark A Moline 2 ,Trisha Bergmann 1 , Joseph J Grzymski 1 , Dwight Peterson 2 , Robert Arnone 3.

E N D
Variability of Measured and Modeled Remote Sensing Reflectance for Coastal Waters at LEO-15 Sasha Tozzi1, Oscar Schofield1, Mark A Moline2,Trisha Bergmann1, Joseph J Grzymski1, Dwight Peterson2, Robert Arnone3 1.Coastal Ocean Observation Laboratory, Institute of Marine and Coastal Sciences, Rutgers University, NJ 2. Biological Sciences Department California Polytechnic State University 3.Naval Research Laboratory, Stennis Space Center, MS
Problem Adaptive sampling approaches are critical for characterizing, quantifying, and sampling episodic events since standard approaches do not resolve their frequency and the disproportionately large role they play on biological and chemical processes in coastal waters. Adaptive sampling depends on remote sensing imagery but coastal waters are optically complex which can significantly compromise remote sensing derived products. As part of ONR and NRL efforts at the Long Term Ecosystem Observatory (LEO-15) new algorithms are being developed and validated for the coastal waters. As part of those efforts, this presentation validates satellite ocean color reflectance data that is used as inputs to satellite models. Field data was collected as part of the 1999 NOPP/ONR/NURP Coastal Predictive Skill Experiment. Experiments were conducted at LEO-15, located off the central coast of New Jersey, which is a large instrumented field site. Instrument package to measure in-water optical properties during the July 1999 Coastal Predictive Skill Experiment.
Methods Satellite data was collected and processed. Alongshore transects were conducted aboard the R.V. Walford during the month long experiment in July, 1999. Ship board profiles of optical parameters were collected. The profiling system was equipped with a Seabird CTD, 13 wavelength TBS-OCR Satlantic spectral radiometer, Wetlabs absorption/attenuation meter (ac-9), Wetlabs spectrofluorometer (SaFire), a HOBI Labs Hydroscat-6 backscatter sensor, beam-c transmissometer, and a Sequoia laser in-situ scattering and transmissometry (LISST). The data presented here is limited to July 16, 1999. Instruments were calibrated throughout the field season using manufacturer recommended protocols. Data was processed and internal consistency between the optically-derived parameters was tested by assessing optical closure between parameters using Hydrolight 4.0. Hydrolight derived remote sensing reflectance was then compared to satellite estimates of remote sensing reflectance as a function of wavelength. DataThe data collected on July 16, 1999 reflected a storm which mixed cold water to the surface. This cold water was visible in AVHRR imagery. Associated with the cold water was enhanced loads of particulate and dissolved matter. The increased material was evident in the in situ optical data (ANN transect shown). To test internal consistency of the insitu data, ac-9 data (using default scattering phase function) was used by Hydrolight to calculate Kd. A total of 22 stations were occupied over 4 transect lines. Kd 440 nm a 440 nm c 440 nm Bb 440 nm
1 1 z 1 412 nm 443 nm 0 0 0 1 0 1 0.5 0.5 510 nm 491 nm 0 0 0 0.5 1 0 0.5 1 Predicted Kd (Hydrolight and ac-9) 1 0.8 1 0.8 0.4 0.5 0.5 0.4 558 nm 703 nm 619 nm 670 nm 0 0 0 0 0 0.5 1 0 0.5 0 0.4 0.8 1 0 0.4 0.8 Measured Kd In situ Closure Generally the inherent optical properties could provided reasonable measurements of the apparent optical properties. Closure was most robust in the blue wavelengths of light. The closure between the IOPs and AOPs was less robust in the red wavelength of light. 1
1.4 1 0.6 0.2 0 Slope of best fit line between measured and predicted Kd 443 510 620 412 490 555 670 705 Wavelength (nm) 1 0.8 0.6 0.4 R2 between measured and predicted Kd 0.2 443 510 620 705 0 412 490 555 670 Wavelength (nm)
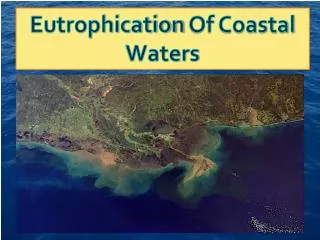
Satellite Imagery Surface cold water was the result of a storm that eroded the water column stratification. Associated with the cold water were high concentrations of chlorophyll a. These features were also visible in the remote sensing reflectance values. 99/07/16 Chlorophyll a (mg m-3) 2.5 1.5 . 5 99/07/16 Rrs @ 555nm (sr-1) .01 .006 .003
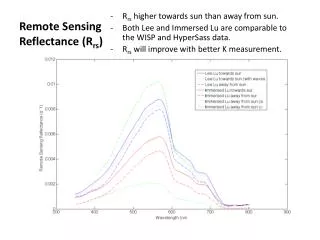
Reflectance In-situ data was used to calculate Remote Sensing Reflectance (via Hydrolight) in optically diverse waters. These values were then compared to Satellite collected reflectance values. The correlation is strong in the the blue wavelengths, but breaks down as you move towards longer wavelengths of light. 412 nm 443 nm 490 nm SeaWiFS Remote Sensing Reflectance Hydrolight 4.0 Remote Sensing Reflectance 510 nm 555 nm 617 nm 0 0 10 10 Distance offshore (km) Distance offshore (km)
Conclusions: Optical closure between IOPs and AOPs was achieved in blue wavelengths of light. Closure was less robust in the red wavelengths of light. The best correlation in the red wavelengths of light was achieved in the soret band associated with chlorophyll a absorption. Comparisons of Hydrolight derived remote sensing reflectance and SeaWiFS reflectance showed: 1) insitu derived reflectance consistently overestimated satellite derived reflectance in the blue wavelengths of light, 2) the correlation is weakest in the red wavelengths of light (676nm).
Acknowledgements Support was provided by numerous agencies including the Office of Naval Research’s COMOP and HyCODE (N00014-97-0767, N0014-99-0196) and a National Ocean Partnership Award (N00014-97-1-1019). Sasha Tozzi Rutgers University Institute of Marine and Coastal Sciences 71, Dudley Road New Brunswick NJ, 08901-8521 phone: 732-932-6555 x 332 fax: 732-932-8578 e-mail: stozzi@imcs.rutgers.edu