Download
1 / 22
220 likes | 317 Views
Graphing the Sine Function. Trigonometry, 4.0: Students graph functions of the form f(t)= Asin ( Bt+C ) or f(t)= Acos ( Bt+C ) and interpret A, B, and C in terms of amplitude, frequency, period, and phase shift. Objectives.

E N D
Graphing the Sine Function Trigonometry, 4.0: Students graph functions of the form f(t)=Asin(Bt+C) or f(t)=Acos(Bt+C) and interpret A, B, and C in terms of amplitude, frequency, period, and phase shift.
Objectives • Students will be able to graph the exact values and interpret the amplitude, frequency, period of the trigonometric function sin(x) • Students will be able to graph the exact values and interpret the amplitude, frequency, period of the trigonometric functions cos(x)
Objectives • For function f(x)=sin(x): • Finding sin(x) for some x value in radians by referring to the graph of the sine function. • Find the values of the angle for which sin(x)=y is true. • Graph f(x)=sin(x) for a given interval for x. • For function f(x)=cos(x): • Finding cos(x) for some x value in radians by referring to the graph of the sine function. • Find the values of the angle for which cos(x)=y is true. • Graph f(x)=cos(x) for a given interval for x.
Recall • A periodic function is a function that repeats for a given interval known as the period • The period of a function is the smallest possible interval for a function that repeats
Recall Example 1 • Determine if each function is periodic. If so, state the period. • The values of the function do not repeat. The function is not periodic.
Recall Example 2 • Determine if each function is periodic. If so, state the period. • The values of the function repeat for each interval of 3 units. The function is periodic and the period is 3.
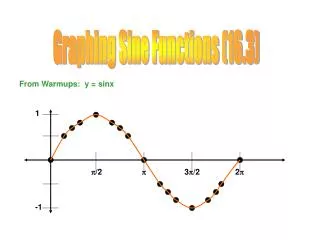
Example 1: Sin(x) • Find by referring to the graph of the sine function. • Because the period of the sine function is 2 and > 2, rewrite as a sum involving 2. • = 2 + • So,= or .
Example 2: Sin(x) • Find the values of for which sin = 1 is true. • Looking at the graph of the sine function, sin = 1 if =, where n is … -3, -1, 0, 1, 3, … .
Example 3: Sin(x) • Graph y = sin x for 5x 7. • The graph crosses the x-axis at 5, 6, and 7. It has its maximum value of 1 at x = , and its minimum value of -1 at x = . Use this information to sketch the graph.
Conclusion for Sin(x) Assignment Summarize • Have students summarize what they have learned about the graph of sin(x) without using notes. Then share with a partner to compare and provide feedback. Lastly, have them refer back to their notes to confirm. • 6.3 Graphing Sine and Cosine Functions pg363#(13-49 odd, 52,55,58 EC) • For cos(x) questions skip. • Problems not finished will be left as homework.
Example 1: cos(x) • Find by referring to the graph of the cosine function. • Because the period of the cosine function is 2and 8> 2, rewrite 8 as a sum involving 2. • 8 = 2(4) + 0 • So, = or .
Example 2: cos(x) • Find the values of for which cos= 0 is true. • Looking at the graph of the cosine function, cos = 0 if =, where n is … -3, -1, 0, 1, 3, … .
Example 3: cos(x) • Graph y = cosx for 9x7. • The graph crosses the x-axis at and . It has its maximum value of 1 at x=8, and its minimum value of -1 at x=9 and 7. Use this information to sketch the graph.
Conclusion for cos(x) Assignment Summarize • Have students compare and contrast the trigonometric graphs of sin(x) and cos(x). • 6.3 Graphing Sine and Cosine Functions pg363#(13-49 odd, 52,55,58 EC) • Now you can finish them all • Problems not finished will be left as homework.
Amplitude sign change sin(x) sin(x) • A reflection about the x-axis!
Amplitude sign change cos(x) cos(x) • A reflection about the x-axis!
Real World Model • METEOROLOGY The average monthly temperatures for a city demonstrate a repetitious behavior. The model which describes the average monthly temperatures for Baltimore, Maryland, is given by y= 54.4 + 22.5 sin ((t - 4)). In this equation, t denotes the month with January represented by t= 1. Find the average temperature for Baltimore, Maryland, for month 10. • Month 10 is October of the first year. To find the average temperature of this month, substitute this value into the equation. • y = 54.4 + 22.5 sin ((t - 4)) • y= 54.4 + 22.5 sin ((10 - 4)) • y = 54.4 + 22.5 sin • y = 54.4 + 22.5 (0) • y = 54.4 • In October, the average monthly temperature for Baltimore is 54.4.
Compare Sine & Cosine • Determine whether the graph represents y = sin x, y = cosx, or neither. • The maximum value of 1 occurs at , , and . • The minimum value of –1 occurs at , , and . • The x-intercepts are 0, , , , 2, , and 3. • This graph does not follow the characteristics of either the sine or the cosine graph. It represents neither of the graphs.