Download
1 / 42
420 likes | 546 Views
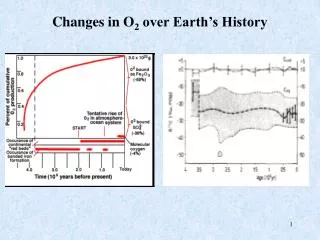
Changes in O 2 over Earth’s History. Annual Cycle in Atmospheric O 2. Barrow 71ºN Samoa 14ºS C. Grim 43ºS (1 ppm O 2 = 5 per meg). Oxygen Isotopes. 16 O = 99.74%, 17 O = 0.05%, 18 O = 0.21% d 18 O (‰) = [( 18 O/ 16 O) sample /( 18 O/ 16 O) std –1]*1000

E N D
Annual Cycle in Atmospheric O2 Barrow 71ºN Samoa 14ºS C. Grim 43ºS (1 ppm O2 = 5 per meg)
Oxygen Isotopes 16O = 99.74%, 17O = 0.05%, 18O = 0.21% d18O (‰) = [(18O/16O)sample/(18O/16O)std –1]*1000 d17O (‰) = [(17O/16O)sample/(17O/16O)std –1]*1000 17Δ (per meg) = [d17O – 0.518*d18O]*1000 Standards: SMOW or AIR (d18O of O2 in air = +23.5 ‰ vs SMOW)
Molecular O2 Cycle Important Processes - photosynthesis, respiration - air-water gas exchange, mixing, circulation Photosynthesis (O2 is from the water molecule) CO2 + 2H2O* +light CH2O + *O2 (2NADP + 2H2O + light 2NADPH2 + O2) Respiration H2O + *O2 + CH2O CO2 + 2H2O* (2NADPH2 + O2 2NADP + 2H2O )
Isotope KIE during Photosynthesis Fractionation effect during photosynthesis by Synechocystis (Helman et al., 2005) (Guy et al., 1993) Little or no fractionation during photosynthetic production of O2 (<1‰)
d18O of Precipitation Globally Mean d18O of precipitation ~ -4 ‰ (assuming mean temp = 15ºC)
Atmospheric Dole Effect • d18O of O2 in air is +23.5 ‰ (vs SMOW) • At steady-state, the d18O of O2 produced by photosynthesis has to equal the d18O of O2 consumed by respiration. (18O/16O)water* photo = (18O/16O)O2air* resp • Since photo = 1.000, then resp = (18O/16O)water / (18O/16O)O2air For marine photosynthesis: resp = 1.000/ 1.0235 = 0.9770 For terrestrial photosynthesis: resp = 1.008/ 1.0235 = 0.9849 For 50/50 split: resp = 1.004/ 1.0235 = 0.9809
Variations in d18O-O2 over glacial cycles (Petite et al., 1999)
Processes Affecting Concentration and d18O of dissolved O2 in Surface Layer Air-Water O2 Gas Exchange g Photosynthesis Respiration Advection, Inflow Turbulent Mixing, Entrainment, Upwelling, Eddies, etc. Organic Carbon Export (= P – R)
Effects of Respiration, Photosynthesis and Gas Exchange on d18O and O2 O2 Concentration - Photosynthesis decreases d18O - Respiration increases d18O - Gas Exchange drives d18O toward equilibrium (24.2 ‰)
d18O-O2 in Amazon Lakes and Rivers Lakes= squares; Amazon R. = circles; Tributaries = triangles
R/P of Amazon Lakes and Rivers Lakes= squares; Amazon R. = circles; Tributaries = triangles
Diurnal Cycles in O2 and d18O in Lakes Tonle Sap Lake, Cambodia Flooded Forest Pond, Canada (vs AIR) Tonle Sap provides 75% of fish harvested in Cambodia (D. Lockwood, unpub data) To detect a diurnal O2 and d18O cycle typically high rates of photosynthesis, low gas exchange rates and shallow water body.
d18O-O2 in Oligotrophic Surface Ocean The overall range (variability) in d18O (0.3 ‰) and O2 saturation (1%) is much smaller than in freshwater systems because of lower photosynthesis rates and higher air-sea gas exchange rates.
Diurnal d18O-O2 Cycle in Coastal Ocean (vs AIR) Sagami Bay, Japan (Sarma, 2005)
d18O vs O2sat Trend in Thermocline of the Pacific Ocean Red = Rayleigh predicted KIE of 0.9945 for respiration
Calculated KIEfor Respiration Assumes open system at steady-state.
Oxygen Cycle: Use of Triple Isotopes • A mass independent reaction during ozone production in the stratosphere causes an anomalous isotopic composition of atmospheric O2 (and CO2). • This O2 isotopic anomaly is a very useful tracer to estimate photosynthesis (productivity) rates on land and in aquatic systems (ocean, lakes, rivers, etc.). • Potentially, this method could make a significant impact on our understanding of the ocean’s biological pump
Anomalous d17O and d18O Composition of Atmospheric O2 and CO2 Lab Experiments Field Measurements 2O2 + energy O3 + O(1D) O(1D) + CO2 CO2 + O Result: Small amount of O2 (CO2) in stratospheric has an anomalously low (high) 17O/18O. This O2 mixes into troposphere.
Isotopic Notation for 17O Anomaly • Express the 17O/16O anomaly using 17Δ notation 17Δ = (d17O – 0.518*d18O)*1000 • Units are per meg, 1 per meg = 1 ‰ / 1000 • AIR is the standard and has a 17Δ = 0 per meg • Since air is depleted in 17O/16O, most other species will have positive 17Δ values on this scale • The coefficient of 0.518 was chosen to equal the slope of d17O vs d18O observed during respiration. (Luz and Barkan, 2000)
17Δ of O2 in water equilibrated with Air (Luz and Barkan, 2003) (Sarma et al, 2006)
17Δ of Photosynthetic O2 Lab Experiments17Δ (per meg vs AIR) Marine Plankton 244±20; 252±5 Sea of Galilee Plankton 159±10 Puget Sound Plankton ~ 200
Ocean Range of 17Δ Values Purely Photosynthetic O2 249 per meg Half Photo + Half Atmos O2 130 per meg 16 per meg Purely Atmospheric O2 Measuring 17Δ yields a direct estimate of the proportion of O2 from air and photosynthesis.
Measured 17Δ in the Surface Ocean 17Δ (per meg) • Oligotrophic N. Pacific (Quay) 20-40 • Oligotrophic N. Atlantic (Luz) 30-50 • Southern Ocean (Hendricks) 20-50 • Equatorial Pacific (Hendricks, Juranek) 50-90 • Sagami Bay (Sarma) 80-100 • California Current System (Munro) 25-100 • Sea of Galilee (Luz and Barken) 100-140
Near Hawaii Near Bermuda L. Juranek (U.Washington) B. Luz (Hebrew U.)
Mixed Layer O2 and 17Δ*O2 Budget • dO2/dt = kam*Sol*pO2atm – kam*Sol*pO2ml + Photo – Resp -where kam = air-sea gas transfer rate and Sol=O2 solubility • d(17Δ*O2/dt) = kam*Sol*pO2atm*17Δair – kam*Sol*pO2ml*17Δdiss + Photo*17Δphoto – Resp*17Δdiss -assume respiration doesn’t change the 17Δ of the dissolved O2 -ignore mixing and advection fluxes for now • Substituting for kam*Sol*pO2ml yields an expression for gross Photo: Photo = kam*pO2atm*Sol*(17Δair – 17Δdiss)/(17Δphoto – 17Δdiss)
Estimating gross Photosynthesis rates from 17Δ • If one estimates air-sea O2 gas transfer rates (kam) from wind speed measurements, then one can calculate the gross Primary Production (PPg) rate from a single measurement (17Δ of dissolved O2) PPg = kam* O2sat * (17air –17diss) (17diss –17photo)
Advantages of 17Δ-PP over 14C-PP Method • In situ PP rates not in vitro PP rates • -there are no bottle effects. • Much simpler field method • -no time consuming bottle incubations • Integrates over the lifetime of O2 in the mixed layer • -typically 10-20 days (i.e., 50-100m / 5m/d) • Measures gross PP rates • -not an ambiguous rate between gross and net PP • -recycling of 14C-labeled OC in the bottle and use of non-14C labeled CO2 during photosynthesis yield biases in PP rates that are difficult to quantify
Disadvantages of the 17Δ-PP Method • Measures gross PP rate integrated over the mixed layer depth, not the photic layer depth. • Uncertainty of method is significant and depends primarily on uncertainty of gas exchange rate (30%) and 17Δ measurement. • Need to convert from O2 production to organic carbon production • -a 10-20% reduction for Mehler reaction and photorespiration • -divide O2 production by the Photosynthetic Quotient (PQ) of ~1.1 (NH4 based PP) to ~1.4 (NO3 based PP) • In some situations, upwelling, mixing or entrainment can bias the 17Δ in the mixed layer causing an overestimation of gross PP.
17Δ Gross PP rates in the Surface Ocean Gross PP (mg C m-2 d-1) • Oligotrophic N. Pacific (Juranek) 800 - 1500 • Oligotrophic N. Atlantic (Luz) 300 - 1000 • Southern Ocean (Hendricks) 600 - 3000 • Equatorial Pacific (Juranek) 1000 - 2000 • Sagami Bay (Sarma) 1500 - 3000 • California Current System (Munro) 100 - 3000 • Sea of Galilee (Luz&Barkan) 1600 – 16000 • Global Ocean (at 1 gmC/m2/d) 130 PgC/yr
Comparison of 17O-PPg versus bottle 14C-PP BATS and HOTS = 1.6±0.4; CalCOFI = 2.7±1.6
Estimating the ratio of net to gross PP • Photo = kam*pO2atm*Sol*(17Δair – 17Δdiss)/(17Δphoto – 17Δdiss) • dO2/dt = kam*pO2atm*Sol*(1 – pO2/pO2atm) + Photo – Resp -assuming net community productivity (NCP) = gross Photosynthesis – total Respiration and substituting for kam*pO2atm*Sol yields: NCP/ Photo = (O2/O2atm – 1)* (17Δphoto – 17Δdiss) / (17Δair – 17Δdiss) • the NCP/PPg ratio yields an estimate of the efficiency of organic carbon recycling in the ocean -if all photosynthetically produced organic carbon was respired to CO2 in the mixed layer then NCP/PPg = 0
Ratio of NCP/PPg in Surface Ocean -at HOT and BATS: 0.13±0.03 -Southern Ocean: 0.17±0.13 -Equatorial Pacific: 0.12±0.11 -California Current 0.16±0.12 • Coastal Ocean has NCP/PPg ratio that is similar to open oligotrophic ocean. (Unexpected). • Could be our most accurate estimate of the efficiency of ocean’s biological pump.
Estimates of Carbon Export (NCP) Rates -at HOT and BATS: 10±5 mmols C m-2 d-1 -in the Southern Ocean: 13±4 -in the Equatorial Pacific: 6.9±6.2 -California Current (CalCOFI): 14±10 -Globally, at 10 mmols m-2 d-1, yields 16 Pg C/yr (higher than previous estimates of 6-10 Pg C/yr)
Future of 17Δ and O2/Ar Ocean Research • Improved ability to detect PP events. • Applicable to obtain large scale synoptic surveys of ocean PP rates. • Improve resolution of short spatial and temporal scale variability in marine PP in certain regions (e.g., coastal). • Useful for validation of satellite PP rates.
Basin Scale Trends in 17Δ-PPg in Pacific Ocean (using a container ship as sample collection platform)