Download

1 / 14
140 likes | 167 Views
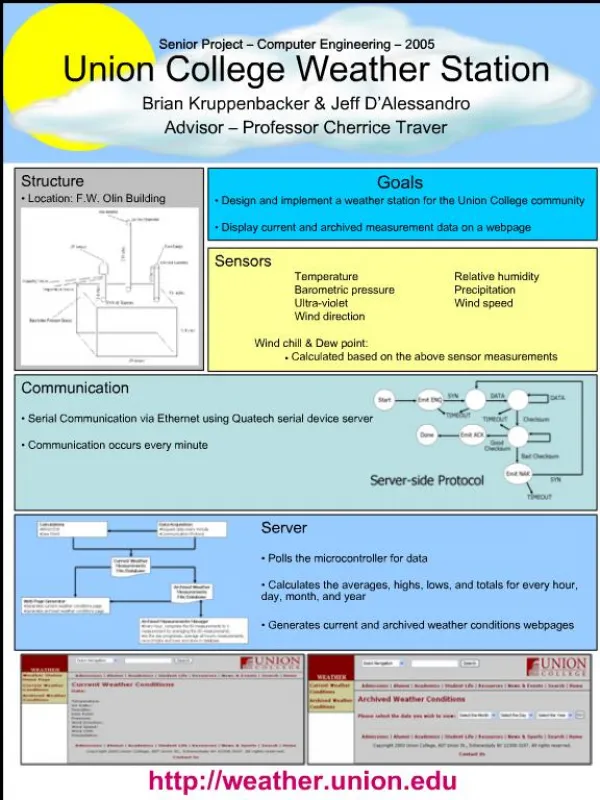
Design and implement a weather station at Union College for reliable weather data collection. Includes website with current conditions and database access. Sensors on roof collect data, sent to server for archiving and website hosting.

E N D
Union College Weather Station Greg Mahlum Advisor: Dean Traver
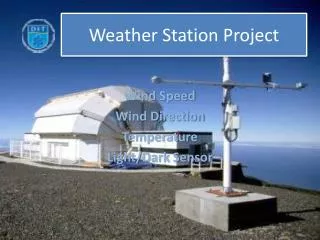
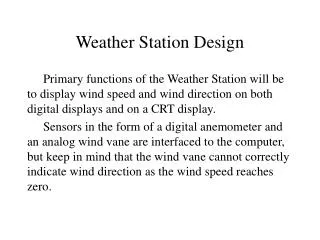
Goals • Design and Implement a weather station for Union College • The goals include: • Website • Current conditions • Easy access to weather data database • Reliable collection of weather data • Record usable amount of data for study
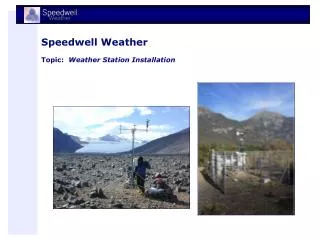
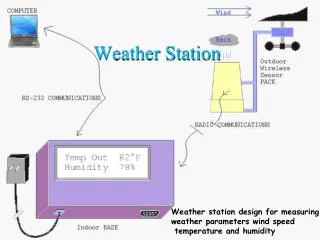
Overview • Sensors on roof of North Wing S&E where weather data can be collected • Microcontroller reads data from sensors • Data sent to a server via Serial Device Server • Server archives data in a database using MySQL and hosts a website using Apache • Scripts used to constantly obtain and archive data • Current and archived data available on website
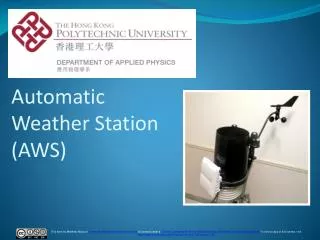
Subsystems • Microcontroller & Sensors • Enclosure • Communication Link • Server • Database • Website
Background • Jeffery D’Alessandro and Brian Kruppenbacker started project for their senior project in 2005 • Microcontroller & Sensors • Replaced humidity sensor • New humidity sensor shorted out • Enclosure • Added braces to stabilize arm supporting UV sensor in order to reduce vibrations due to machinery on the floor below
Communication • Serial to Ethernet communication using a Moxa serial device server • Wide temperature model needed due to cold temperatures in the winter • Uses protocol developed by previous group • RS-232 • 9600 baud, 8 data bits, 1 stop bit, no parity • Uses cyclic redundancy check for error detection
Server • Current server used for development • Programs and scripts will be moved to a server that gets routine maintenance once development is completed • Until development is finished the old Robot Club computer used as server • Dell Dimension 8200 • 6 years old • 40 GB Hard Drive • Partitioned Hard Drive into three parts • 10 GB for system files • 1 GB for swap space • Everything else (~27 GB) for weather data
OS • Fedora 7 original OS • Compatibility issues with serial device server drivers • Issues must be resolved before project can be moved to a maintained server • Fedora Core 5 • Current OS of development server
Database • Used MySQL for database managment • Two tables used to keep track of data • Past hour • Keeps track of the weather in the past hour • Every hour data currently in table is averaged, the result is added to the archived weather table • Archived weather • Biggest table, contains one entry for every hour
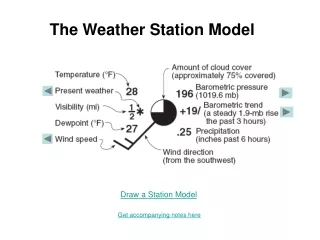
Website • http://weather.union.edu • Apache used for web server program • Display current weather conditions • Temperature • Humidity • Pressure • Precipitation • UV index • Wind direction and speed • Dew point • Wind chill • Heat index • Allow users to view archived weather • Users able to select specific periods of time • Data is pulled from database using built in functions in php
Data Collection • Sample as frequently as possible • Readings received every 9-10sec • Each reading archived in past hour table • Averages taken every hour • Result placed in archived weather table • Frequency of averaging can be adjusted using crontab
Testing & Monitoring for Accuracy • Used Geology Department station and weather.com to visually compare data • Initial inspections • Temperature readings on average 14% higher than geology department readings • Pressure consistently 4% lower • UV readings never exceed 1.0 • Need to inspect data at each point in the system to find where errors may be • Voltage output from sensor • Digital conversion from microcontroller • Calculation on server
Thanks • Dean Traver • Professor Spallholtz • Frank Tricozzi • Aaron Lagasse