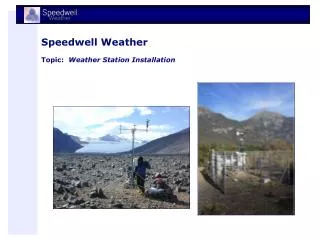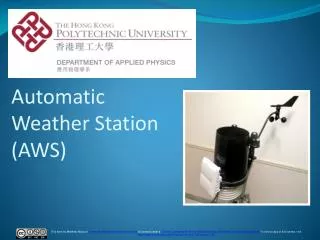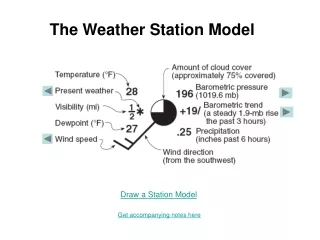
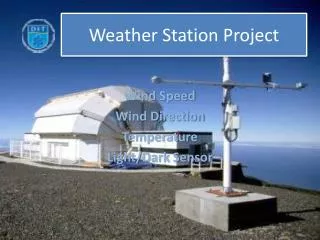
Weather Station Project
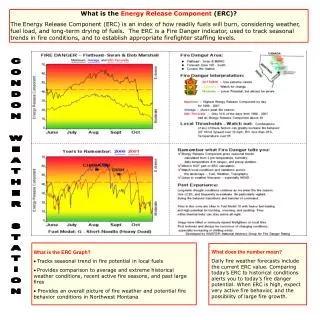
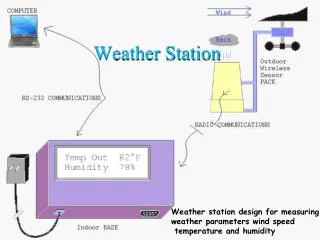
Weather Station Project. Wind Speed Wind Direction Temperature Light/Dark Sensor. Anemometer Design. Fx2N. Fx2N4AD. Wind Speed. Dc Motor. Lm3900N. Computer net. Km/h. mV. V. Counts. Digits.

Weather Station Project
E N D
Presentation Transcript
Weather Station Project Wind Speed Wind Direction Temperature Light/Dark Sensor
Anemometer Design • Fx2N • Fx2N4AD • Wind Speed • Dc Motor • Lm3900N • Computer • net • Km/h • mV • V • Counts • Digits Anemometer consists of four horizontal arms with cups on the end. The arms are at right angle and they are joined in the middle at a single point that rests on a vertical pivot fixed on a motor. When the wind blows, it pushes the cups and causes the horizontal arms to rotate. The cups must face the same direction, and they will provide the maximum torque when they are positioned at 45-degree angles to the wind flow. By measuring the rate at which the anemometer rotates, the wind speed may be calculated. MATERIAL USED 4 small paper cups (like drinking cups) A wooden fan four arms A dc motor 12V Plastic and wooden supporters Battery 9V Opamp mod Lm3900N 3 resistor 1Ω 1 resistor 12Ω Breadboard Anemometer Construction Breadboard Connection
Anemometer Conclusions • Main Conclusions • Get voltage values good enough to be converted in digit and fed into a weather website • We decided to give it a gain of 4. The Lm3900N in the non inverting amplifier connection gives A=R2/R1+1 (than R1=12Ω, R2=3Ω). • The calibration of the instrument was the hardest part. These due to the fact that we need to take measurements in a not winding day. • After the first results we realize that the system was reliable but not able to catch wind with velocity lower than 20km/h. • Than to improve it, we have changed the motor with one with less friction; also we have chosen cups of bigger size. Test of the Device
Wind Direction Sensor Design For this instrument we decided to show wind direction in its 8 most uses directions, N, NE, E, SE, S, SW, W, NW. The design of the instrument is quite simple, each directional point has its own resistive circuit which all connect to a common single resistor across which the voltage is measured to give us our direction. It is essentially a voltage divider circuit. We divided our 10V supply voltage by 8 (No. Of directions) and chose resistor values for each directional circuit in order to scale our voltage output evenly across 8 steps (as can be seen in the table below). WIND VANE AD MODULE PLC PYTHON INTERNET EXPLORER APACHE WEB SERVER MySQL Direction Contacts
Wind Direction Sensor Design The device is fed by a 10V DC supply through the directional arrow’s shaft and on to the direction contacts sticking up from its box, and according to what direction the wind is blowing a different voltage output is generated. The directional arrow can only be in contact with one circuit at a time so as not to give a false reading. It is based on the more complicated vane that measures wind direction in 360 degree format. With the addition of more directional circuits our model could measure wind direction in the same manner, in theory.
Wind Direction Sensor Conclusions We are quite pleased with how well this instrument turned out, it is durable and its success lies in its simplicity. Because we used a 0-10v DC supply to begin with we could connect the vane directly to our PLC which was helpful and because there is a substantial difference between each of our 8 input voltages it is unlikely that an error could occur in the PLC.
Temperature Variable Assembly • LM 324N Instrumentation amplifier • LM 324N: Used to amplify voltage using negative feedback • Resistor values • Ri=474 Ω • Rf=10 kΩ • Gain ( ) = 22.09 • With these resistor values, we got a gain of 22.09, which enabled us to get a maximum voltage swing from the LM 324N amplifier. • LM35 temperature sensor • Soldered cables with heat shrink • Vout • Vin Rf Ri = 1+ • Vout • Vin
Block Diagram & Conclusions 9V Battery PLC A/D card (12 bit) Website Display PC SCADA System 0-1900 counts 0-0.35 V 0-7.76 V LM35 (0-35 C) LM324N amplifier HTML language Conclusions • Max. operating temperature from LM35 = 100 C • Min. operating temperature from LM35 = 0 C • Unsuitable for detecting negative temperatures • Amplified output voltage is linearly proportional to the temperature (C) • Low power consumption • Good output voltage swing from amplifier for A/D conversion in the PLC
Light/Dark Sensor Construction Circuit Connection The circuit is built based on LDR (photo resistor) an operational amplifier 741 The LDR is used as a light sensor which resistance change with intensity of Light Op Amp 741 amplifies voltages going out from LDR to reach the PLC specification 0-10V 0.36-1.3 V 0-1900 Counts
Light/Dark Sensor Objectives Characteristic of LDR Main Objectives of the device The LDR Characteristic shows decrease resistance compare to increase light intensity (LUX) Ideally the sensor should detect even small changes in light intensity and convert them to relative voltage between 0-10V
Light/Dark Sensor Results Device Results Op Amp Input LDR Measurements
Light/Dark Sensor Conclusions Final Conclusions and changes The main goal was achieved. The device works and detect light changes. Sensitivity regulation is possible by changes in potentiometer's resistance, however the resolution stays on the low level. It means that the sensor works in mode on/off and doesn’t detect small changes in the light intensity. The supply voltage was decreased from 12V to 9V to provide suitable power source from two batteries 4.5V connected in series. By changes in power supply the “Dark Voltage” drops from 11.22V below 10V and can be detect by PLC. Despite the device doesn’t work as was assumed at the beginning of the project it’s still can be used in the project as Light/dark sensor or cloud detector.