Download
1 / 60
600 likes | 785 Views
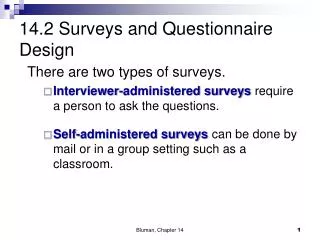
STAT 4060 Design and Analysis of Surveys. Exam: 6 0% Mid Test: 20% Mini Project: 10 % Continuous assessment : 10 %. What we have learned:. 1. Simple random sampling, confidence interval and choice of sample size.

E N D
STAT 4060 Design and Analysis of Surveys • Exam: 60% • Mid Test: 20% • Mini Project: 10% • Continuous assessment:10% www.uic.edu.hk/~xlpeng
What we have learned: 1. Simple random sampling, confidence interval and choice of sample size. 2. Ratio and regression estimators, systematic sampling. 3. Stratified random sampling, allocation of stratum weights. 4. Cluster sampling. www.uic.edu.hk/~xlpeng
Population Parameter www.uic.edu.hk/~xlpeng
Sample Statistics www.uic.edu.hk/~xlpeng
Simple random sampling • We shall consider the use of simple random samples for estimating the three population characteristics: the population mean the population total and the proportion P. • We shall discuss how any estimators behave in terms of their sampling distributions. The variance is often a crucial measure. www.uic.edu.hk/~xlpeng
Proof of (1.9) www.uic.edu.hk/~xlpeng
Confidence interval for the population mean www.uic.edu.hk/~xlpeng
Ratio Estimation and Regression Estimation(Chapter 4, Textbook, Barnett, V., 1991) 2.1 Estimation of a population ratio: The ratio estimator • In some situations it is useful to estimate a (positive) ratio of two population characteristics: the totals, or means, of two (positive) variables X and Y. www.uic.edu.hk/~xlpeng
Two obvious estimators of R are The sample average of ratio unbiased for estimating the population mean The ratio of the sample averages is widely used. but biased for estimating R www.uic.edu.hk/~xlpeng
The bias in estimating R by r The bias in estimating R by r is the expectation of the following difference: (2.3) www.uic.edu.hk/~xlpeng
Discussion about the bias ≈ www.uic.edu.hk/~xlpeng
(2.5) www.uic.edu.hk/~xlpeng
2.2 Ratio estimation of a population mean or total www.uic.edu.hk/~xlpeng
Variance of ratio estimator www.uic.edu.hk/~xlpeng
Solution: The estimate of the ratio R of the present weight to prestudy weight for the herd is: www.uic.edu.hk/~xlpeng
This examines when the variance of (2.10) could be less or greater than that of (1.9) www.uic.edu.hk/~xlpeng
2.3 Regression estimation Condition (2.15.1) demands that X and Y be linearly related, but, if the linear relationship does not pass through the origin, then, it suggests considering an alternative estimator known as regression estimator. www.uic.edu.hk/~xlpeng
2.3 Regression estimation . An ideal (perfect) linear relationship is (2.16) A practicable simple linear regression model is (2.17) (2.18) www.uic.edu.hk/~xlpeng
2.3 Regression estimation Consider the average (mean) of either (2.16) or (2.17), (2.19) www.uic.edu.hk/~xlpeng
2.3 Regression estimation (2.20) www.uic.edu.hk/~xlpeng
2.3 Regression estimation From (2.20), (2.22) The minimum is obtained with Thus the most efficient regression estimator of is www.uic.edu.hk/~xlpeng
2.3 Regression estimation The optimal value of b of (2.22) suggests the obvious estimate: (2.24) (2.25) which enjoys the following asymptotic properties: www.uic.edu.hk/~xlpeng
2.3 Regression estimation Asymptotic properties: (2.26) (2.27) www.uic.edu.hk/~xlpeng
2.4 Comparison of ratio and regression estimators www.uic.edu.hk/~xlpeng
2.4 Comparison of ratio and regression estimators www.uic.edu.hk/~xlpeng
Stratified Simple Random Sampling(Chapter 5, Textbook, Barnett, V., 1991) Consider another sampling method: www.uic.edu.hk/~xlpeng
Some Notations To estimate the population mean of a finite population, we assume that the population is stratified, that is to say it has been divided into k non-overlapping groups, or strata, of sizes: The stratum means and variances are denoted by and www.uic.edu.hk/~xlpeng
Estimation of Population Characteristicsin Stratified Populations www.uic.edu.hk/~xlpeng
Estimating The stratified sample mean is defined as Here we assume the weights Wi=Ni /N is given (known). www.uic.edu.hk/~xlpeng
The mean and variance of Note that Since Because it is assumed that “sampling in different strata are independent”, that is www.uic.edu.hk/~xlpeng
Simple random sampling Stratified sampling with proportional allocation www.uic.edu.hk/~xlpeng
(a) When stratum size is large enough: www.uic.edu.hk/~xlpeng
(b) When stratum size is not large enough: The stratified sample mean will be more efficient than the s.r. sample mean If and only if variation between the stratum means is sufficiently large compared with within-strata variation! www.uic.edu.hk/~xlpeng
Optimum Choice of Sample Size • To achieve required precision of estimation • Some cost limitation The simplest form assumes that there is some overhead cost, c0 of administering The survey, and that individual observations from the ith stratum each cost an Amount ci. Thus the total cost is: www.uic.edu.hk/~xlpeng
I. Minimum variance for fixed cost (Cont.) www.uic.edu.hk/~xlpeng
I. Minimum variance for fixed cost (Cont.) Then www.uic.edu.hk/~xlpeng
II. Minimum cost for fixed variance Consider to satisfy for the minimum possible total cost. www.uic.edu.hk/~xlpeng
Comparison of proportional allocation and optimum allocation Thus the extent of the potential gain from optimum (Neyman) allocation Compared with proportional allocation depends on the variability of the stratum variances: the larger this is, the greater the relative advantage Of optimum allocation. www.uic.edu.hk/~xlpeng
Cluster Sampling(Chapter 6, Textbook, Barnett, V., 1991) www.uic.edu.hk/~xlpeng