Oligopoly Markets: Models and Strategies for Dominant Firms
Learn about the oligopoly market structure, including the Cournot Duopoly and Kinked Demand Curve models, collusion, and cartel operations. Discover motivations for collaboration, equilibrium scenarios, and the theory behind cartels in oligopoly markets.

Oligopoly Markets: Models and Strategies for Dominant Firms
E N D
Presentation Transcript
14 Oligopoly
Number of Firms? Many firms Type of Products? One Few Differentiated Identical firm firms products products Monopolistic Perfect Monopoly Oligopoly Competition Competition • Tap water • Tennis balls • Novels • Wheat • Cable TV • Crude oil • Movies • Milk The Four Types of Market Structure
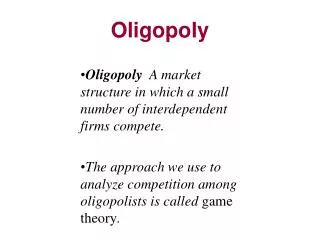
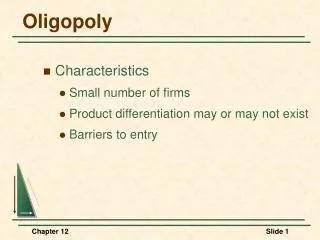
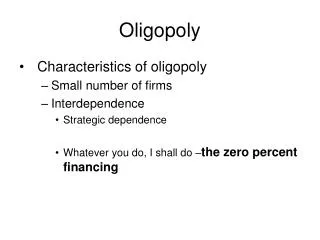
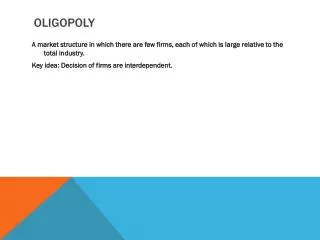
Oligopoly • An oligopoly is a form of industry (market) structure characterized by a few dominant firms. Products may be homogeneous or differentiated. • The behavior of any one firm in an oligopoly depends to a great extent on the behavior of others. • Because of the few sellers, the key feature of oligopoly is the tension between cooperation and self-interest. • Substantial barriers to entry
Collusion and Competition Oligopoly firms may collude (act as a monopoly) and earn positive profits. OR Oligopolists may compete with each other and drive prices down to where profits are zero.
Duopoly • A duopoly is an oligopoly with only two members. It is the simplest type of oligopoly. • The duopolists may agree on a monopoly outcome. • Collusion • An agreement among firms in a market about quantities to produce or prices to charge. • Cartel • A group of firms acting in unison.
Oligopoly Models • The important models of non-collusive oligopoly are: (a) Cournot Duopoly model (b) Kinked Oligopoly demand curve models. • The two major theories of collusive oligopoly are: (a) Joint profit maximization - Cartels (b) Price leadership.
Cournot Duopoly model • The Cournot model is in terms of duopoly (two sellers) but it can be easily extended to an oligopolistic situation. • This model analyses the process of equilibrium in a duopoly situation when each duopolist assumes that his rival will not react when he changes his output to maximize profits.
Assumptions • There are two sellers in the market. • The products sold by these two sellers are homogeneous. • The market, or total demand curve, is known and it is a straight line. • Each duopolist assumes that his rival’s output will remain constant when he changes his output. Thus, each duopolist assumes his rival will not react to his action. • Each duopolist produces output of which the profits are at the maximum. • The cost of production is zero for both the sellers. • The average and marginal costs for each seller are zero and these curves coincide with the X-axis.
Cournot Duopoly model Firm & Industry Output:-
Cournot Duopoly Equilibrium The Total Industry output is given as: The average market share of each firm in the industry is:
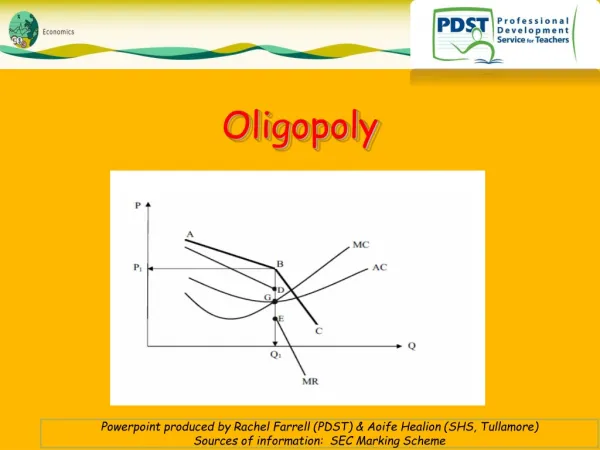
The Kinked Demand Curve Model • The kinked demand model is a model of oligopoly in which the demand curve facing each individual firm has a “kink” in it. The kink follows from the assumption that competitive firms will follow if a single firm cuts price but will not follow if a single firm raises price.
The Kinked Demand Curve Model • Above P*, an increase in price, which is not followed by competitors, results in a large decrease in the firm’s quantity demanded (demand is elastic). • Below P*, price decreases are followed by competitors so the firm does not gain as much quantity demanded (demand is inelastic).
Kinked Demand Curve Model • Sweezy’s kinked demand curve model explains the rigidity or stickiness in oligopolistic prices in the face of short-term increases or decreases in variable input costs. When costs of raw materials or labour rise, profits will get squeezed and when these costs fall, the benefit of lower input costs will not be passed on to the consumers. • The Sweezy model of kinked demand curve under oligopoly explains why prices of oligopolistic firms are inflexible and fail to reflect short-run changes in variable costs of raw materials and wages.
Cartel • A cartel is a formal collusive organization of the oligopoly firms in an industry. There may either be an open or secret collusion. • A perfect cartel is an extreme form of collusion in which member firms agree to abide by the instructions from a central agency in order to maximise joint profits. • The profits are distributed among the member firms in a way jointly decided by the firms in advance and may not be in proportion to its share in total output or the costs it incurs.
Theory of Cartels • Objectives: • 1) minimize industry costs for any given output (produce where all firms have the same MC). • 2) restrict output and maximize industry-wide profits. Sum MC curves to find industry-wide S curve. Equate that to MR, and sell from the related demand curve. Each firm produce the quota where short-run industry MC = industry MR
Motivations for Collusion a) Decrease competition, achieve monopoly-like behavior b) Decrease uncertainty c) Decrease ease of entry
$ $ $ MCa MC ACa MCb ACb 0 X 0 X 0 X Qa Qb Qc Cartels Decision making is carried on by the central organization. It sets price and output. Firm A Firm B Industry D MR Objective: Minimize industry costs for any given output. Allocate quotas to members so the MC of each producing firm at its quota output is equal to MC of every other firm.
The Price-Leadership Model • Price-leadership is a form of oligopoly in which one dominant firm sets prices and all the smaller firms in the industry follow its pricing policy. • It may become monopolist but compromises with the small rival firms which in turn accept the dominant firm as the price setter and behave as if they are firms under perfect competition i.e. price takers.
The Price-Leadership Model • Assumptions of the price-leadership model: • It is assumed that the dominant firm knows the aggregate market demand. It finds its own demand curve by setting a price and deduct from the market demand the quantity supplied jointly by the small firms. • It also knows the supply curve of the small firms through a knowledge of their individual MC curves. The part of the market demand not supplied by the small firms will be its own share. Given a price, the market share of the dominant firm equals the market demand less the share of small firms.
Dominant Firm The large firm can set the price and receives a marginal revenue that is less than price along the curve MR. Dominant Firm’s Demand Curve Residual Demand
Dominant Firm As long as the dominant firm has lower costs, it can act like a monopolist over the residual demand.
The Price-Leadership Model • Outcome of the price-leadership model: • The quantity demanded in the industry is split between the dominant firm and the group of smaller firms. • This division of output is determined by the amount of market power that the dominant firm has. • The dominant firm has an incentive to push smaller firms out of the industry in order to establish a monopoly.