Oligopoly
Oligopoly. Topic 7(b). OLIGOPOLY Contents. 1. Characteristics 2. Game theory 3. Oligopoly Models: a. Kinked Demand Curve b. Price leadership c. Collusion d. Cost-plus pricing 4. Assessment of Oligopoly. Oligopoly.

Oligopoly
E N D
Presentation Transcript
Oligopoly Topic 7(b)
OLIGOPOLY Contents 1. Characteristics 2. Game theory 3. Oligopoly Models: a. Kinked Demand Curve b. Price leadership c. Collusion d. Cost-plus pricing 4. Assessment of Oligopoly
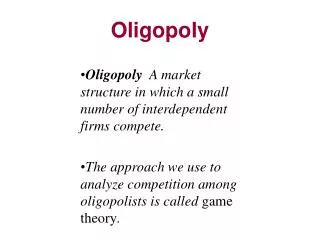
Oligopoly • In this topic we will consider the behaviour of firms when the industry is made up of only a few firms: oligopoly. • A crucial feature of oligopoly is the interdependence between firms’ decisions.
Interdependence between firms • In oligopoly, the industry is made up of only a few firms. • Each of these firms makes up a significant part of the total market. • Each can exercise some market power (eg. their output decisions influence the market price). • Therefore, each firm’s decisions influence the decisions made by the other firms. • In other words, firms’ decisions are interdependent.
Characteristics of Oligopoly • Small mutually interdependent number of firms controlling the market • Significant market power • One firm cut the prices => others are affected • Homogenous or differentiated products • High barriers to entry • Examples
Non-price competition… • is common in oligopoly, such as: • advertising, product innovation, improvement of service to customers. • is preferred to price wars which usually bring losses to all parties.
2. Game Theory • A model of strategic moves and countermoves of rivals. • Firms chooses strategies based on their assumptions about competitors likely behaviour or response. • Strategies could relate to pricing, advertising, product range, customer groups etc. • Game theory provides a framework or model to help analyse this behaviour.
2. Game Theory – a two-firm Payoff matrix • Two airlines competing for the domestic air travel market • Vietnam Airlines • Jetstar • Assume two airlines choose their strategy independently (ie. No collusion) • Payoffs are the outcomes (or profits) for the 2 firms for each combination of strategies.
2. Game Theory – MAXIMIN strategy • Firms maximise the minimum expected payoff. • For Vietnam Airlines: • if they choose a Low Fare option, they will receive either $8m or $20m profit, depending on the option chosen by JS – so the worse VA will make $8m profit. • If they choose a High Fare option, they will receive either $5m or $15m – the worse is $5m profit • The maximum (the best) of these two minimums is $8m, so VA will choose the Low Fare option.
2. Game Theory – MAXIMIN strategy • For Jetstar: • if they choose a Low Fare option, they will receive either $8m or $20m profit, depending on the option chosen by VA – so the worse Jetstar will make $8m profit. • If they choose a High Fare option, they will receive either $5m or $15m – the worse is $5m profit • The maximum (the best) of these two minimums is $8m, so JS will also choose the Low Fare option. • Both firms choose the Low Fare option if act independently. • There is an incentive to collude
2. Game Theory – MAXIMIN strategy • For VA: • Low Fare: Min. $10m profit ; Max. $15m profit • High Fare: Min. $12m profit; Max. $20m profit => VA choose High Fare option • For JS: • Low Fare: Min. $5m profit; Max. $8m profit • High Fare: Min. $2m profit; Max. $10m profit => JS choose Low Fare option Possibly, they cater for different market segments. There is no incentive to collude
3. Oligopoly ModelsKinked Demand Curve Model • D1: When the firm changes prices => other firms react similarly • There is no substitution effect • demand will change but not by much • demand is price inelastic • D2: When the firm changes price => other firms don’t follow. • There is substitution effect • Change in demand more sensitive to price changes • Relatively elastic curve Rivals ignore Rivals match
Kinked demand curve for a firm under oligopoly $ • Assumptions: • Independent among firms (ie. no collusion) • Rivals will match price decreases and ignore price increases A B P1 D Q O Q1 fig
The MR curve $ B P1 MR a D = AR Q O Q1
The MR curve $ P1 a D = AR b Q O Q1 MR
As long as MC shifts within C1 & C2, the optimum output is Qo & price is Po => stable price 3. Oligopoly ModelsKinked Demand curve
Stable price under conditions of a kinked demand curve $ MC2 MC1 P1 a D = AR b Q O Q1 MR
Kinked Demand Curve Model • Assumptions: • All firms are independent (ie. no collusion) • Rivals match price decreases and ignore price increases • Implication of Kinked Demand Curve: Stable Price • If a firm raises price, it will lose customers and sales to other firms • If it reduces price, other firms will match => a price war. • Therefore, firms tend to maintain the same price. • Substantial cost changes will have no effect on output and price as long as MC shifts between C1 & C2. Another reason why price is stable. • Limitations • It does not explain the determination of current price • Sometimes prices rise substantially during inflation period, which is contrary to the stable price conclusions of Oligopoly
3. Oligopoly Modelsb)Price Leadership Model • Assumes implicit collusion • Follow the leader • dominant firm makes prices changes • most efficient, oldest, most respected, largest • others follow • Usually • prices don’t change very often • price changes are very public • price may be low to act as barrier to entry
Price leader aiming to maximise profitsfor a given market share $ AR = Dmarket O Q fig
Price leader aiming to maximise profitsfor a given market share $ Assume constant market share for leader AR = Dmarket AR = Dleader O Q fig
Price leader aiming to maximise profitsfor a given market share $ AR = Dmarket AR = Dleader MRleader O Q fig
Price leader aiming to maximise profitsfor a given market share $ MC AR = Dmarket AR = Dleader MRleader O Q fig
Price leader aiming to maximise profitsfor a given market share $ MC l PL AR = Dmarket AR = Dleader MRleader O QL Q fig
Price leader aiming to maximise profitsfor a given market share $ MC l t PL AR = Dmarket AR = Dleader MRleader O QL QT Q fig
3. Oligopoly Models c) Collusion • Definition: when an industry reaches an open or secret agreement to • fix price • divide up or share the market • or other ways of restricting competition b/w themselves.
3. Oligopoly Models c) Collusion Why collude? • removes uncertainty • no price wars • increase profits • barrier to entry • Types of collusion • Explicit • centralised cartel (OPEC) • Implicit • price leadership model
Collusion (contd.) • Difficulties: • Difference in cost structures • Large number of firms in the market • Cheating • Falling demand • Legal barriers
3. Oligopoly Modelsd) Cost-plus pricing • Also known as “mark-up” pricing • Price = unit cost + a margin (%) • Example: the unit cost of washing machines is $200 plus a 50% mark-up => Price = $300. • If producers in an industry have roughly similar costs, then the cost-plus pricing formula will result in similar prices and price changes. • Therefore, Cost-plus pricing is consistent with collusion and price leadership.
4. Assessing oligopoly • Negatives: • P > MC : no allocative efficiency • P > min. AC : no productive efficiency • Collusion • Positives: • Economies of scale • Innovation