Download
1 / 23
230 likes | 251 Views
Design a scalable teaching unit to help students understand and interpret population growth equations and graphs. Assessment includes formative evaluations, group activities, and experiments with bacterial population growth. Emphasis on forecasting and interpreting growth rates.

E N D
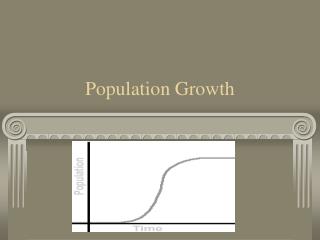
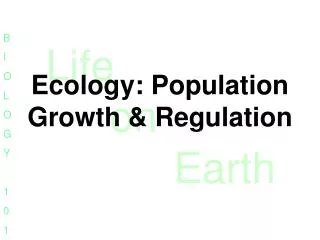
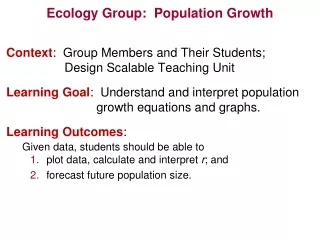
Ecology Group: Population Growth Context: Group Members and Their Students; Design Scalable Teaching Unit Learning Goal: Understand and interpret population growth equations and graphs. Learning Outcomes: Given data, students should be able to • plot data, calculate and interpret r; and • forecast future population size.
Ecology Group: Population Growth Assessment: • Gauge prior knowledge • Multiple Choice Questions (clickers) • Concept Mapping • Terminology Challenge – Card Game in Groups • Calculate Instantaneous Growth Rate; Predict Population Size • Chalk-Talk • Formative assessment (MCQs, clickers) • Group Activity: Physical Model, Growth of Bacterial Population • Addressing Diversity • Post-Group Activity Formative Assessment
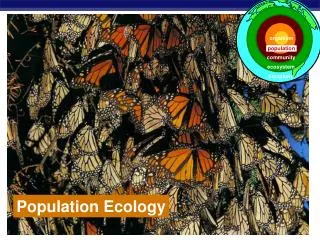
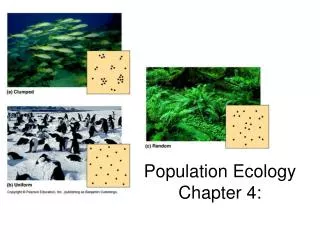
What Do You Know? • A _______ is defined as a group of individuals of a single species that occupies the same general area. A. population B. community C. ecosystem D. biome
What Do You Know? • The size of the human population has not changed in the last 200 years. A. True B. False
What Do You Know? • The maximum number of individuals a habitat can support indefinitely is called the _______. A. population fitness B. community size C. carrying capacity D. reproductive potential
What Do You Know? • log10(100)= _______. A. 0.01 B. 10 C. 0.1 D. 2
Chalk Talk I • Explain exponential
Chalk Talk I N = population size B = birth rate D = death rate b = per capita birth rate d = per capita death rate r = instantaneous growth rate N0 = initial population size Nt = population size at time t
Experimental Design • 5 cups containing skittles • Each skittle = an individual Meningococcal skittlus • Cup = time of sampling M. skittlus bacteria.
Step I • Is the population size increasing, decreasing, or stable? • Count the number of bacteria per sampling period – population size (N) • Graph your 5 data points using N and t as your coordinates (Is N on the x or y axis? t?) * • How would you predict population size at the sixth sampling period (N6)?
Step II • Plot the data on semilog paper. • Is the population increasing, declining, or staying stable? • How would you estimate instantaneous growth rate (r)? • How would you estimate population size at time zero (N0) ?
Check of the Facts – Part I • If r is positive, the population should: • Grow. • Shrink. • Stay the Same. • The dog ate my homework.
Check of the Facts – Part II • If r is positive, the population’s: • Deaths = Births. • Deaths > Births. • Deaths < Births. • I love Brussels sprout.
What Do You Think? The type of growth illustrated by the global human population during the past 2,000 years is _______. A. exponential C. linear • logistic D. extra-exponential
Future Directions • Explain curves graphically, written (freshman, nonmajors), equations (seniors) • Incorporate software packages (MS Excel, R) • Calculate N6 given logNt = logN0 + rt • Add stochasticity to data (biological variation) • Add terms for: • Logistic growth – includes K • Interspecific competition • Predator prey • Phenotype confers fitness advantage – evolution • Radioactive decay and age dating
Possible Summative Assessment Questions • Calculate the population size at year seven of a lion population with an initial population size of 20 and an intrinsic growth rate of 0.1 (rounded to the nearest whole number). • 25 • 30 • 35 • 40
More • Which r value best fits the curve in the figure? • -0.25 • -0.7 • 0.25 • 0.7
Summative Assessment • Q: The endangered purple falcon, which is endemic to your state, has a current population size of 10 individuals in 2012. The population growth rate of the falcon over the past decade has been 0.05. Delisting of the falcon from the Endangered Species List can occur when the population reaches 1000 individuals. Using the density-independent population growth equation, when should the falcon be delisted? • A: 46 years [question can be answered without a calculator if need be.]
Logistic Growth Assessment • In the figure above, the term (K- N)/K A. is greatest when N is large. B. becomes smaller as N approaches K. C. becomes larger as N approaches K. D. is the carrying capacity for a population.
More questions. • Q:Explain the differences between exponential and logistic growth. What are the differences with regard to growth rates over time? What drives those differences (what is different about their habitats)? What is the difference in their differential equations? What is the difference in the shape of the curves? Which is most commonly found in nature?