Download

1 / 32
320 likes | 350 Views
Health Economics for Prescribers. Richard Smith (MED) richard.smith@uea.ac.uk David Wright (CAP) d.j.wright@uea.ac.uk. Deciding upon study question Viewpoint taken. Alternatives appraised. Assessment of costs and benefits Identification of relevant C&B. Measurement of C&B.

E N D
Health Economics for Prescribers Richard Smith (MED) richard.smith@uea.ac.uk David Wright (CAP) d.j.wright@uea.ac.uk
Deciding upon study question • Viewpoint taken. • Alternatives appraised. • Assessment of costs and benefits • Identification of relevant C&B. • Measurement of C&B. • Valuation of C (&B). Adjustment for timing. Adjustment for uncertainty. Making a decision. Stages in economic evaluation Lecture 2 Lectures 3 & 4 Lecture 3 Lecture 5
‘Drummond’ checklist • Was a well-defined question posed in answerable form? • Was a comprehensive description of alternatives given? • Was there evidence that effectiveness had been established? • Were all the important and relevant costs and consequences for each alternative identified? • Were costs and consequences measured accurately/appropriately? • Were costs and consequences valued credibly? • Were costs and consequences adjusted for differential timing? • Was an incremental analysis performed? • Was allowance made for uncertainty? • Did presentation/discussion of results include all issues of concern?
Lecture 5: Pharmaco-economic evaluation – analysis and results • Use of models • Decision-tree • Markov (state transition) model • Uncertainty (sensitivity analysis) [checklist 9] • Presentation & discussion of results [checklist 10] • Indices • Wider discussion – limitations, other studies, other viewpoints, generalizability, feasibility, etc • Using economic evaluation • QALY ‘league tables’ • NICE • Pharmaceutical companies and pharmacists
1. Use of models • What is a ‘model’? • A simplification of reality to capture the ‘essence’ of the problem with the minimum level of complexity • Why use a model? • To synthesise data from multiple sources • To handle uncertainty & assumptions, e.g. • To extrapolate from intermediate to final outcomes • To predict outcomes that are unknown or are unethical to collect • Handle ambiguity of clinical data and variations in interpretation
Types of models • Descriptive • describes • Prescriptive • suggests • Deterministic • certainty • Stochastic • probability
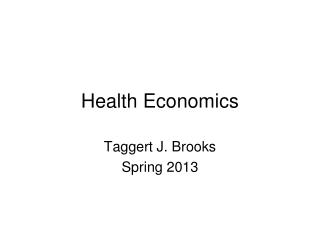
Leaves Decision node Branches Chance node Example stochastic, prescriptive model (decision-tree)
Analysis of decision-tree • Decision tree is averaged out to get the expected value (EV) for each strategy (from decision node) • EV is the sum of products of the estimates of probability of events and their outcomes (payoff) EV = 0.5x100 + 0.5x0 = £50
Example cont … Cost (have cancer) 0.829x£4,974=£4,124 0.171x£9,108=£1,558 £4,124+£1,558=£5,682 £5,682x0.004=£23 Cost (no cancer) =£24 EV(cost) screening =£23+£24=£47
Markov Modelling • Used when disease progresses over time • Patients grouped into a finite number of (Markov) states • Time progresses in equal increments (Markov cycles) • All events or progression are represented as transitions from one state to another with a certain probability • Transitions (probability of improvement or deterioration) calculated from epidemiological and/or clinical data • Spending one cycle in a given state is associated with a certain cost and a defined outcome
Important points about models • Structure • Type of model (eg Decision-tree or Markov) • Elements of model (eg nodes, branches, states) • Sources of data • Probability • Values (cost and outcomes) • Conduct of sensitivity analysis to assess impact of these on the final result
2. Handling uncertainty • Sensitivity analysis • Systematically examining the influence of uncertainties in the variables and assumptions employed on the estimated results • E.g. change in a unit cost value of 10% lead to change in result of >10% (sensitive) or <10% (insensitive)? • Further analysis might include • Alternative (sub)perspectives • Use of intermediate outcome measures • Subgroup analysis
Process of sensitivity analysis • Identifying the (uncertain) variables • All variables in the analysis are potential candidates • Give reasons for exclusion rather than inclusion • Specifying the plausible range over which they should vary • Reviewing the literature • Consulting expert opinion • Using a specified confidence interval around the mean • Recalculating results based on combinations of the best guesses, most and least conservative, usually based on… • One-way analysis (each variable separately) • Multi-way analysis (number of variables together) • Extreme scenario analysis (all variables in extreme combinations) • Threshold analysis (amount of variance needed to achieve specified result)
3. Presentation and discussion of results • What do the decision makers want to know? • Is there a health gain? • Is there a cost difference? • What is the relationship between cost and outcome differences? • Is the cost justified by the benefit (CEA/CUA)? • Is there a net gain (CBA)? • Is this result robust or sensitive to parameters?
Type of Analysis Costs Consequences Result Cost Minimisation Money Identical in all respects. Least cost alternative. Cost Effectiveness Money Different magnitude of a common measure eg., LY’s gained, blood pressure reduction. Cost per unit of consequence eg. cost per LY gained. Cost Utility Money Single or multiple effects not necessarily common. Valued as “utility” eg. QALY Cost per unit of consequence eg. cost per QALY. Cost Benefit Money As for CUA but valued in money. Net £ cost: benefit ratio. Overall index depends on type of economic evaluation
Discussion – placing results in context • Description • Describe and interpret the meaning of the results • Explicitly discuss any possible bias and results of sensitivity analysis • Limitations • Guide to interpreting and generalizing the results • Need to compensate for the study’s shortcomings • Relevance of the study • Place the results into the decision context (see study question) • Compare with other studies • Within the same disease area or across interventions • Macro implications • What effect would the intervention have on the health of the larger population? • What are the resource implications, how much would it cost to provide it for everyone under the NHS?
Be wary! • Any conclusion that a treatment is “cost-effective” should be viewed critically • Strictly true only if it dominates the comparator • If the ICER is estimated, so intervention is more effective and more costly, then who is the author to say that society is willing to pay that amount for the outcome? • Although can say, for example, that the intervention is cost effective when compared to other accepted interventions
4. Using economic evaluations • QALY ‘league tables’ • NICE • Pharmaceutical companies and pharmacists
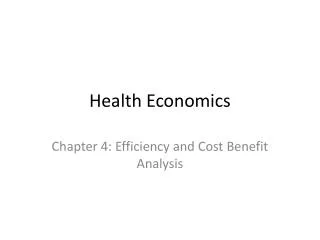
QALY League Tables • Health care interventions can be compared in terms of their relative cost-effectiveness if comparable outcomes are employed (QALYs, life years) • This allows analysts to place their findings in a broader context of cost-effectiveness • This allows for decisions to be made about allocating resources between competing interventions (ranking of results)
Example league table for UK 5 ‘hip QALYs’ or 1 ‘heart QALY’? Threshold
Objections to their use • Differences in methodology • Choice of comparator • Choice of discount rate • Method of estimating utility values • Range of costs included • Application of decision rules in practice • Issue of divisibility or returns to scale • What ‘threshold’ should be used?
NICE (National Institute for Health and Clinical Effectiveness) • Intended to provide “authoritative, robust and reliable guidance on current best practice” • Remit to produce national guidance on • Individual technologies, appraisal • Management of specific conditions, clinical guidance • Clinical audit • Criteria for making decisions • clinical priorities • clinical need • “broad balance of benefits and costs” • guidance on resources likely to be available
NICE mess • Does not have implementation budget • Issues of transparency • Lobbying by patient and provider groups • Too NICE to say no? • Doesn’t advise on what to disinvest in • Issues of “mandatory” vs. “advisory” guidance • Refusal to rank technologies in any form of hierarchy, and thus refusal to admit explicitly a cost per QALY threshold (although recently changed) but implicitly…
Value of a QALY • It appears NICE believe a QALY has a value of ~£30,000 • But is this the value the public place on a QALY? • Recall one of the principles of welfare economics • relevant source of monetary value of health outcomes is individual WTP • So, what is the public’s willingness to pay for a QALY? • Current ‘cutting edge’ research in economic evaluation (team from UEA, Newcastle & Aberdeen)
Pharmaceutical companies and pharmacists Think about this for the next workshop when looking at checklist item 10 on “issues of concern to users”… …you will be users of this information so what issues are relevant to you?
Final thoughts ... • Practical problems when using results of an evaluation • The way in which a health care system operates • The fact that there exists political rationing criteria over and above that of ‘efficiency’ – need to take account of this • Economic evaluation is an aid to the decision making process – it does not make decisions • It might not provide the perfect basis for decision making • But the question is: is it better than anything else “Don’t let the pursuit of the perfect lead you to dismiss that which is merely very good” Alan Williams