Download
1 / 26
270 likes | 292 Views
This report explores methods to analyze and visualize social small-world graphs, aiding users in understanding complex network structures and relationships. The report covers the concept of small-world graphs, problem exploration, attribute calculations, graph exploration, and more. With a focus on user-friendly visualization techniques, the study aims to enhance insights into network dynamics.

E N D
Discovering Parametric Clusters inSocial Small-World Graphs Advisor :Dr. Hsu Reporter:Wen-Hsiang Hu Author:Jonathan、KwanLiu and Michael 2005 ACM Symposium on Applied Computing
Outline • Motivation • Objective • What is a small world graph? • The Problem • Initial layout ->Derived attributes calculations->Graph exploration->Automatic self-organizing layout->User-controlled force-directed layout • Case Study • Conclusion • Future Work • Personal Opinion
Motivation • It may be difficult or impossible to help users explore the networks and develop insights concerning their members and structure via traditional means, including existing graph visualization and/or statistical methods.
Objective • Our approach helps users explore the networks and develop insights concerning their members and structure. • Analyzing large, social small-world graphs
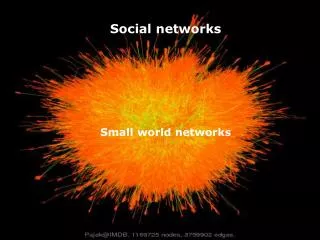
What is a small world graph?(1/3) • Graphs from a surprising number of disciplines have been discovered to have small world properties. • When people say “it’s a small world,” they are expressing their surprise that they know a stranger through a short chain of acquaintances. • In small world graphs, the average length of the path from one entity to another is small even though the graph is often quite large.
What is a small world graph? (2/3) • The two main characteristic qualities of a small-world graph are small average path length and large clustering coefficient. • Construct a subgraph G’(V ’, E’) of the graph G that contains the node and all its neighbors.
What is a small world graph? (3/3) • The clustering coefficient C of a graph G(V,E) can be computed by letting E = E’ and V = V’ in the formula above. • The average path length L of a graph is the average of the values given by an all-pairs shortest path algorithm. Let • Lrand be the average path length of a random graph (a graph with randomly connected nodes • Crand be the clustering coefficient of a random graph random graph A small world
The Problem • These are some of the things that we would like to be able to discover about a graph. • What are the “social groups,” or cliques, present in the graph? • What are the properties of these groups? For each, what is its relative size? relative connectivity? topology? • How many of these groups are there? Do they have common properties? • How are these groups related to each other?
ABOUT THE SAMPLE DATA SET • synthetic data set with 1,000 nodes and 10,000 edges • This data was generated by a group that is interested in the use of graphs to model relationships between entities related to national security — a node, for instance, • might represent a terrorist attack, a terrorist, a meeting, and so forth.
Our Approach Figure 1: The basic process of visualization alternates between machine processing and human user processing. The goal is to arrive at a visualization of a segment of a small world graph which answers a specific question the user asks.
Initial layout (1/3) • Displaying all nodes and all edges is not useful even for a small graph like our synthetic data set (See Figure 2(a)). • Using a spanning tree permits preservation of the structure of the graph while eliminating the vast majority of the edges; spanning tree
Initial layout (2/3) • However, the main goal in generating the tree is to give us an input to the layout algorithm. • Layout algorithm uses Euclidean space made primarily to preserve the user’s “mental map” of the data. Initial layout layout algorithm children parent
Initial layout (3/3) • Layout algorithm V.S. H3 (Euclidean space) (hyperbolic space)
Derived attributes calculations • Markov clustering algorithm (MCL) can be applied to assign a “cluster id” to each vertex. • MCL is a cluster detection algorithm that can detect graph clusters.
Attribute mapping (1/3) • If the user is mapping a data source to a color, he is presented with a gradient editor (漸層色編輯器) that corresponds to and has the same width as the histogram. Initial layout gradient editor (d) mapping color to cluster id.
Attribute mapping (2/3) • If the user is mapping a data source to a size, he is presented with a transfer function editor. transfer function editor (e) mapping size to node degree (from clustering coefficient).
Attribute mapping (3/3) • Figure 3 contains a screen capture of the user interface used to make the mappings and to select subgraphs.
Subgraph selection • The mechanism we use for subgraph selection is apainting histogram. • When a subgraph is selected, all the edges in that subgraph are displayed. • The edge confusion will be resolved by the next stage of visualization, but some structure is already apparent here.
Kohonen maps • A technique called a Kohonen map [9] is used to generate a layout that automatically finds these kinds of clusters. • SOMs—organize high-dimensional data onto a 2-dimensional grid while preserving the data clusters in higher dimensions. Figure 4: Automatic clustering. The self-organizing map has put each node into one of five “parametric clusters” partitioned by graph nearness and node degree. We selected a feature vector consisting of node degree and “cluster id.”
User-controlled force-directed layout (1/2) • At this point, we have a layout that has been generated by the Kohonen map. But: • while it may be a fine layout of data points, it is not a terribly good layout for a graph. • the self-organizing map may place two or more points at the same location. • To resolve the issue, a hybrid algorithm is used: a user-controlled force-directed (力導向演算法) layout. • At any point, the user can do either of the following: • perform small number of iterations of a force-directed algorithm with limited displacement. • move a group of nodes to anywhere in the visualization space.
User-controlled force-directed layout(2/2) • First, Each of the three clusters (red, yellow, and green) seems to have a “master node” that is of much higher degree than the others, and is connected to the other “master nodes”. • Second, the yellow cluster talks to the red cluster almost entirely through its “master node”; there are virtually no connections between the yellow and red groups. Figure 5: Parametric clusters have been pushed apart by the force-directed layout algorithm after several iterations.
CASE STUDY: KAZAA FILE-SHARING GRAPH (1/2) • 2,400 nodes (users) and 13,300 edges (between users).
CASE STUDY: KAZAA FILE-SHARING GRAPH (2/2) • Figure 7: • a neighborhood size that tends to attract a disproportionate number of well-connected users • one user who has a very large number of connections for someone from such a small neighborhood. Figure 8: users with lots of connections showed up as large spheres—e.g. the trio in (2) selecting a subgraph consisting of nodes with very high clustering coefficient so that tightly connected neighborhoods—e.g. (1) were shown.
Conclusion • We have described a cohesive, step-by-step process for exploring small-world graphs. • Our study forms a good basis for further study in this area.
FUTURE WORK • Better graph clustering algorithm • we would like to find a fast algorithm to generate some vector Dk for each node k. • Better SOM implementation • it uses the “bubble function” rather than a Gaussian to regulate the strength of vector adjustment as distance from the epicenter increases. • Weighted feature-vector components • We would like to find weights w1,w2, . . . ,wnfor each of the n dimensions of the feature vector, such that the weight wi represents the importance of separating groups based on attribute i.
Personal Opinion • Strength • adapting or modifying many techniques to suit the design goals. • Weakness • Algorithms are not clear in this paper. • No appropriate visualization evaluation standard. • Application • Apply to any hierarchical information structure.