Download
1 / 3
30 likes | 46 Views
A Flight Engineer - The Engine Data Management 900 System for Aircraft

E N D
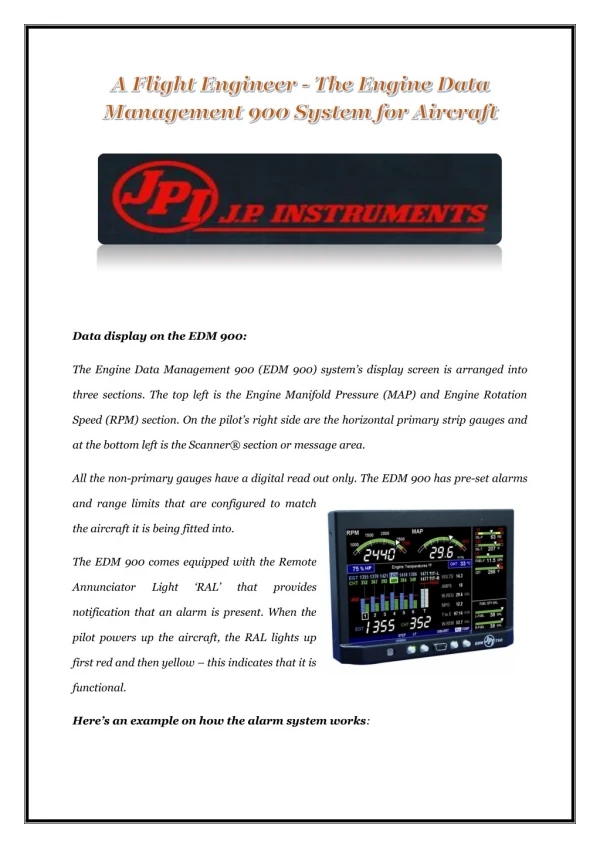
Data display on the EDM 900: The Engine Data Management 900 (EDM 900) system’s display screen is arranged into three sections. The top left is the Engine Manifold Pressure (MAP) and Engine Rotation Speed (RPM) section. On the pilot’s right side are the horizontal primary strip gauges and at the bottom left is the Scanner® section or message area. All the non-primary gauges have a digital read out only. The EDM 900 has pre-set alarms and range limits that are configured to match the aircraft it is being fitted into. The EDM 900 comes equipped with the Remote Annunciator Light ‘RAL’ that provides notification that an alarm is present. When the pilot powers up the aircraft, the RAL lights up first red and then yellow – this indicates that it is functional. Here’s an example on how the alarm system works:
If the RPM or MAP of the aircraft is high, the RPM / MAP digits will turn red or yellow and just so the pilot does not miss it, the RAL light too will turn on. Simultaneously, the scanner message area will display the error code. Similarly, in the Bar Graphs section the digital readouts turn red. The EDM 900 display & control: The EDM monitors engine pressures, temperatures and voltages; it assists in fine-tuning the air/fuel mixture, and helps diagnose engine malfunctions. The control part consists of 4 front panel buttons located below the display area. The display itself consists of the MAP and RPM in the upper left corner of the display screen. The Classic Scanner analog display including cylinder number and index square are displayed in the lower left corner whereas, the numeric readouts and messages are at the bottom left. The Bar graphs are displayed on the right half of the display screen. The height of each column (bar graph), represents a CHT or EGT or TIT (if installed) temperature. Below each bar graph column, are numbers that identifying the cylinder. If the TIT Probes option is installed, it is labelled by the letter ‘T’ underneath. The linear bar graphs (on the right side of the display), indicate oil temperature, oil pressure, compressor discharge temperature, fuel flow, tank fuel quantity (left and right). The same area also displays non-primary data such as fuel pressure, voltage, amps, fuel used, remaining and TOE (estimated), as well as Outside Air Temperature Probe. The EDM display brightness will auto adjust. However, the pilot can also manually adjust the brightness by taping on the ‘Dim’ button. The Aircraft Engine Data Management 900 for aircraft has four operating modes; automatic, manual, Program and LeanFind. The Automatic mode displays information for the majority of flight conditions. To optimize the mixture, select the LeanFind mode. To display specific parameters, use the Manual mode.
EDM Monitors are called flight engineers because they provide the same data that earlier required a human flight engineer to sit and laboriously calculate each value. EDM’s display the same information in an instant, it does so flawlessly. For more information, please visit: https://www.jpinstruments.com/shop/edm- 900-2/