Download

1 / 33
340 likes | 373 Views
Learn the basics of univariate statistics including central tendency, dispersion, mode, median, and mean. Understand skewed distributions, frequency distributions, and the importance of the normal curve. Discover how to correct for skewed variables and measure dispersion using range, standard deviation, and variance.

E N D
Basic Statistical Principles • Central tendency • Dispersion • Standardization
Central tendency • Mode • Median • Mean • Skewed distributions
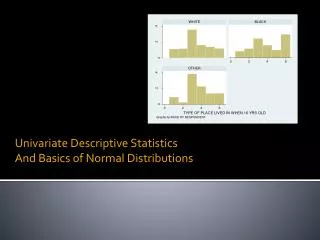
Frequency distributions • Show n of cases falling in each category of a variable • Starting point for analysis • Reveals out of range data • Signals missing data to be specified • Identifies values to be recoded
Mode • The most common score • E.g. (gender): Frequency Males 123 Females 148 -Female is the modal category
Median • Arrange individual scores from top to bottom and take the middle score • E.g. (Exam scores): Score Frequency 100 1 90 3 80 3 Median = 70 70 6 60 2
Mean • Statistical average (total scores/number of scores) • E.g. (Exam scores): Score Frequency 100 1 90 3 80 3 Median = 70 70 6 Mean = 76.7 60 2
Skewed distributions • Median may be a better indicator of central tendency • Example: Typical employee income • CEOs make 100 times average worker • Outlier distorts the average • Median works better • Income Frequency $5,000,000 1 Mean= $99,500 $50,000 99 Median = $50,000
The Normal Curve 50% of cases are above the midpoint 50% of cases are below the midpoint
Importance of the Normal Curve • Many of the statistical analysis techniques that we’ll be talking about assume • Normally distributed variables • This assumption is: • Rarely checked • Often violated
Correcting for skewed distributions • Ways to correct for skewed variables: • Square root a positively skewed variable • Square a negatively skewed variable
Dispersion • How spread out are the scores from the mean? • Are they tightly packed around the mean Or • Are they spread out?
Dispersion Measures • Range • Standard Deviation • Variance
Range • Distance between the top and bottom score • E.g., Hi Score = 96, Lo Score = 42, Range = 54 • Only tells you about the extremity of the scores • These 3 distributions have the same range: • 10, 11, 12, 13, 14, 15, 90 • 10, 85, 86,87,88,89,90 • 10,48,49,50,51,52,90
Standard Deviation and Variance • Both account for the position of all the scores • Both measure the spread of the scores
Standard Deviation Small Variance (small SD) Large Variance (large SD)
Standard Deviation and Variance:Measures of Dispersion • Standard deviation • measure of the width of the dispersion • or spread of the scores • or size of the average distance of scores from mean • The squared value of the standard deviation (sd2) is called the variance
Steps in Calculating Standard Deviation • Steps: • 1. Calculate the mean • 2. Subtract mean from each score (deviations) • 3. Square all deviations • 4. Add up squared deviations • 5. Divide sum of squared deviations by N • 6. Take the square root of the resulting value
Formula for Standard Deviation • Formula averages distance of scores from mean: For a population For a sample used to estimate population sd
Example of Calculation (sd) Scores x-M Square 16 16-10 = 6 36 12 12-10 = 2 4 10 10-10 = 0 0 6 6-10 = -4 16 6 6-10 = -4 16 Mean = 10 (50/5) Sum of Squares = 72 72/5 = 14.4 Sq root = 3.79
Calculating Variance • Same as standard deviation without last step • Standard deviation’s descriptive utility • If standard deviation is 5, the average distance from the mean is 5 • Variance is building block for other procedures
Standardization • Converting variables to a uniform scale • Mean = 0 • Standard deviation = 1 • Formula: z score = (score – mean)/standard deviation
Standardization and Normal Curve • 68% of cases fall within 1 standard deviation of the mean • 95% of cases fall within 2 standard deviations of the mean • 99% of cases fall within 3 standard deviations of the mean
Functions of Standardization • Makes two variables comparable • Allows us to compare within groups • Allows us to compare across collections • Stepping stone to other procedures (e.g., Pearson Correlation Coefficient)
Standardizing and Variable Comparability Example • Students took two exams: Exam 1 Exam 2 Student A 90 90 Student B 80 100 Student C 80 100 Student D 80 100 Student E 70 10 Mean = 80 80
Standardizing and Variable Comparability Example Exam 1 Z1 Exam 2 Z2 A 90 1.58 90 .28 B 80 0 100 .57 C 80 0 100 .57 D 80 0 100 .57 E 70 -1.58 10 -1.99
Standardizing and Within Group Comparability Person: Height: z-Height: Amos 5’8” -.50 Burt 6’1” .75 Cedric 6’5” 1.75 Arlene 5’1” -1.33 Bertha 5’4” -.33 Carla 5’11” 2.00 Men Women Population Mean 5’10” 5’5” Population SD 4” 3”