Download
1 / 29
290 likes | 330 Views
This overview covers the importance of in-situ X-ray scattering, experimental design considerations, various beamline setups, sample preparation techniques, data analysis methods, reactions with X-ray scattering, and practical examples engaging EXAFS data. The discussion includes insights on traditional powder diffraction challenges, such as sample dehydration and artifacts, and offers solutions for optimizing sample preparation and analysis processes for different sample types. Future improvements in reaction flow setups and analytical tools are also explored within this informative session.

E N D
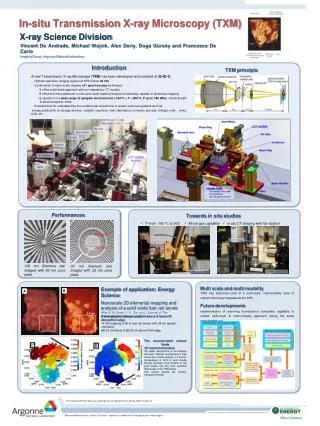
Applications of in-situ X-ray Scattering Techniques Sam Webb SSRL Scattering Workshop May 15, 2007
Overview • Why in situ? • Experimental Design • Beamlines • Sample prep • Analysis • Reactions with x-ray scattering • Example(s)
Why Should I Do Scattering When I Have EXAFS Data? Triclinic Birnessite Triclinic Birnessite Hexagonal Birnessite Hexagonal Birnessite d-MnO2 d-MnO2 EXAFS = Local Structure WAXS = Long-Range Structure
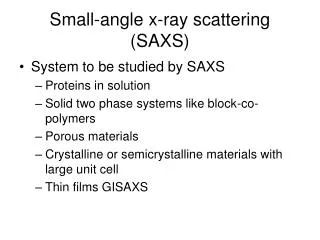
Why In-situ • Traditional powder diffraction experiments require dry, fine powders as samples • For many biological and environmental samples: • Drying = artifact • Dehydration, exposure to air • Powder = artifact • Other thoughts to consider… • Sample throughput • Sample textures • Timing/Reactions
Experimental Design • Does my sample need to be wet? • Transmission vs. reflection • Tradeoffs due to backgrounds of sample holder and water • High resolution vs. low • Soller slits vs. analyzer vs. area detector • Data range • Exposure to beam? • Exposure to air?
collimating slits scattered x-rays incident beam sample Diffractometer (SSRL BL 2-1) detector analyzer
Powder Scattering Experiment X-ray source (Synchrotron) • Monochromatic • Sample contains all crystal orientations • Detector and sample angles unchanged Mono Detector Slits Sample Beamstop
Diffractometer (SSRL 11-3) • Tight spaces in hutch • Samples: • Flat plate transmission • Reflection (half of area detector) • Capillary • BL software (Blu-Ice) • 5-10 MB per picture
Diffractometer (SSRL 11-3) • Tight spaces in hutch • Samples: • Flat plate transmission • Reflection (half of area detector) • Capillary • BL software (Blu-Ice) • 5-10 MB per picture
top plate lexan windows sample shim spacer bottom plate Sample Preparation (Flat plate) • Keep sample hydrated to avoid artifacts! • Change in oxidation state/mineralogy • Collapse of hydrated structures • Use transmission geometry • Why? - Better subtraction of background scattering (water, windows) • Window material important • Lexan is a good material for background removal (WAXS) • Water peaks in similar places as silica • Optimize sample thickness depending on l and sample composition. Sample should absorb ~ 20‑50% of incident beam. One “m” is about max. • Other sample holders – goniometer head – sample distance ~ 37 mm (11-3, 7-2)
What if I have a powder for transmission? • Flat plate is poor for dry samples • Particles are not generally stable and settle – even out of beam! • Need a better support – tape! • Kapton not ideal • Scotch Magic tape (translucent)
Data Analysis • CCD to diffractogram (2D to 1D) • Geometry corrections • Background subtraction • Windows, capillary, tape • Water • Other interferences (cotton, etc)
2q Integration of Powder Pattern • What Can it Tell? • Peak Positions: • Phase identification • Lattice symmetry • Peak Shape & Width: • Crystallite size • Textures (preferential orientation, multiple phases, etc.) • Peak Intensity: • Crystal structure • FIT2D • http://www.esrf.fr/computing/scientific/FIT2D/
t q t cos q Theta Dependent Effects • Absorption • Samples absorb the incident and transmitted beams Abs = (t / cos q) exp(-mt/cos q) • Measure sample absorption at the beamline! • Volume effect • 1/cos q dependence • Compton Scattering • Highest at large q In order to get proper removal of background (windows, water) these corrections must be made. Critical for thicker samples!
Background Subtraction • Background in experiments consists of lexan windows and water
http://www-ssrl.stanford.edu/~swebb/xrdbs.htm RDSUB • GUI for removal of background and thickness corrections • Designed for use with Fit-2D output (chi files)
Reactions • Mineral-solution reactions • Time scale of minutes to hours • Redox reactions • Cation exchange • Colloid transport • Sample prep = miniaturized “columns” (i.e., particles packed in a capillary) • Lexan capillary • Better background (no overlap with water like silica) • Doesn’t break! • Particle size and porosity • Clogging • Flow rate • Stalling of pump
Reaction Flow Setup (not to scale) Tubing Scattered Beam Sample Cotton Gasketed capillary holder Incident beam 120 mL Syringe pump Flow collection system
Future Improvements… • Peristaltic pump vs. syringe pump • Better flow and ability to change reactant solutions • Development of better column packing materials • Gas impermeable tubing • Improve anaerobic conditions • Injection loop • Easy loading of capillary • Fraction collector • Analysis of post-reaction fluids • Fluorescence detector • Monitor elemental changes in sample if reactions lead to deposition / removal of compounds
Examples • Mn biomineral structures • Compare 2-1 and 11-3 data quality • Real time biogenic Mn oxidation • Area detectors in reactions • MnOxide reactions with metals • Area detectors in reactions • Sulfide mineral oxidation • Wet-dry artifacts for air sensitive minerals • Air exposure
BL 11-3 2 minute exposure 360 degrees are better than 1! BL 2-1 Sum of 4 to 5 scans, ~8 hours total Mn Oxide Biomineral Structure Tradeoff between noise-resolution-time
a a a* Triclinic Hexagonal b Biogenic Mn Oxidation • Mn oxidation in seawater progresses through symmetry changes in oxide structure • Due to the effect of Ca present in interlayers
Manganese in-situ Oxidation Mn(II) Spores Mn(IV) 2d 1d Triclinic peaks Mn(IV) Oxide Q (nm-1) Spores Scan No. (~20 min between scan)
Manganese oxide reaction with metals Co(II) • Co(II) reacts with pre-formed biogenic oxides to oxidize to Co(III). Mn-oxides are reduced • No evidence of new Co(III) minerals Mn(IV) Decrease in (001) amplitude Time (h) Q (A-1)
Biogenic MnOxides + Co(II) • 001 peak broadens with reaction and shifts to larger d-spacings • Changes follow pseudo-first order reaction kinetics • Slow and fast steps of Co(III) incorporation
Wet-Dry Artifacts • Measurements of anaerobic, dried sample lead to formation of peaks with different texture FeS dried FeS paste, anaerobic
~1.2 mm from end O2 FeS O2 10 8 6 4 2 0 Time (h) Fe-Sulfide oxidation reactions 2-line Ferrihydrite Mackinawite t=7 t=8 t=9 t=10 t=0
Acknowledgements • Anna Obraztsova and Greg Dick (SIO) • Apurva Mehta (SSRL) • Tanya Gallegos (U of M) • Funding: • NSF-CRAEMS • DOE-BER • DOE-BES R/V Knorr, Black Sea, 2003