Early Psychology Results: Stimulus-Response Graphs Comparison
Explore the relationship between stimulus magnitude (x) and response magnitude (y) with a constant k. Compare the graphs for k=1, 2, and ½ to understand the impact on response.

Early Psychology Results: Stimulus-Response Graphs Comparison
E N D
Presentation Transcript
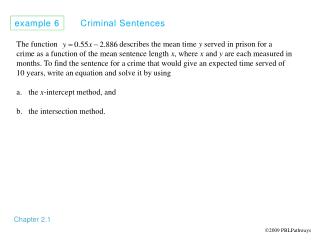
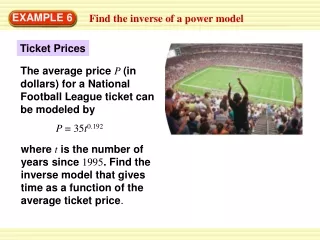
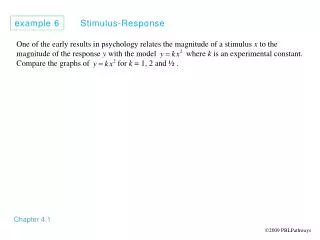
example 6 Stimulus-Response Chapter 4.1 One of the early results in psychology relates the magnitude of a stimulus x to the magnitude of the response y with the model where k is an experimental constant. Compare the graphs of for k = 1, 2 and ½ . 2009 PBLPathways
One of the early results in psychology relates the magnitude of a stimulus x to the magnitude of the response y with the model where k is an experimental constant. Compare the graphs of for k = 1, 2 and ½ .
One of the early results in psychology relates the magnitude of a stimulus x to the magnitude of the response y with the model where k is an experimental constant. Compare the graphs of for k = 1, 2 and ½ .
One of the early results in psychology relates the magnitude of a stimulus x to the magnitude of the response y with the model where k is an experimental constant. Compare the graphs of for k = 1, 2 and ½ .
One of the early results in psychology relates the magnitude of a stimulus x to the magnitude of the response y with the model where k is an experimental constant. Compare the graphs of for k = 1, 2 and ½ .
One of the early results in psychology relates the magnitude of a stimulus x to the magnitude of the response y with the model where k is an experimental constant. Compare the graphs of for k = 1, 2 and ½ .
One of the early results in psychology relates the magnitude of a stimulus x to the magnitude of the response y with the model where k is an experimental constant. Compare the graphs of for k = 1, 2 and ½ .
One of the early results in psychology relates the magnitude of a stimulus x to the magnitude of the response y with the model where k is an experimental constant. Compare the graphs of for k = 1, 2 and ½ .
One of the early results in psychology relates the magnitude of a stimulus x to the magnitude of the response y with the model where k is an experimental constant. Compare the graphs of for k = 1, 2 and ½ .
One of the early results in psychology relates the magnitude of a stimulus x to the magnitude of the response y with the model where k is an experimental constant. Compare the graphs of for k = 1, 2 and ½ .
One of the early results in psychology relates the magnitude of a stimulus x to the magnitude of the response y with the model where k is an experimental constant. Compare the graphs of for k = 1, 2 and ½ .
One of the early results in psychology relates the magnitude of a stimulus x to the magnitude of the response y with the model where k is an experimental constant. Compare the graphs of for k = 1, 2 and ½ .