EXAMPLE 6
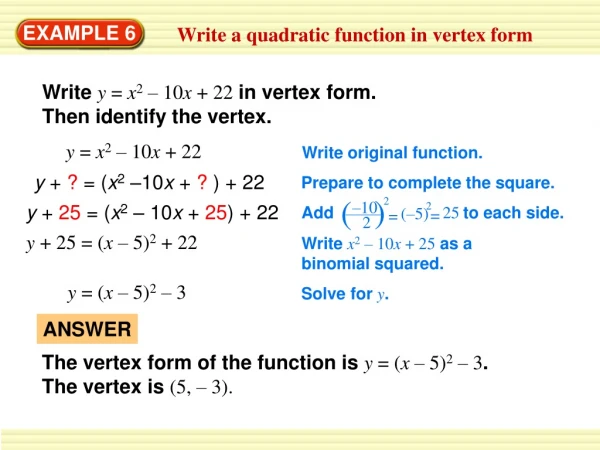
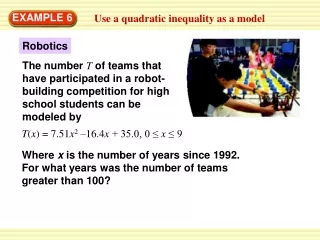
COMMUNITY THEATER. A community theater performed a play each Saturday evening for 10 consecutive weeks. The graph shows the attendance for the performances in weeks 1, 4, 6, and 10. Describe the rates of change in attendance with respect to time. EXAMPLE 6.

EXAMPLE 6
E N D
Presentation Transcript
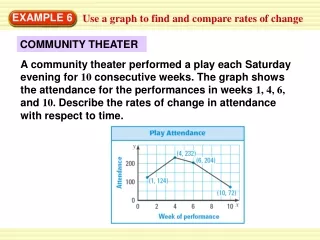
COMMUNITY THEATER A community theater performed a play each Saturday evening for 10 consecutive weeks. The graph shows the attendance for the performances in weeks 1, 4, 6, and 10. Describe the rates of change in attendance with respect to time. EXAMPLE 6 Use a graph to find and compare rates of change
108 –28 232 – 124 = 1 4 – 3 2 204 – 232 = 4 6 – 72 – 204 –132 = 6 10 – 4 ANSWER Attendance increased during the early weeks of performing the play. Then attendance decreased, slowly at first, then more rapidly. EXAMPLE 6 Use a graph to find and compare rates of change SOLUTION Find the rates of change using the slope formula. =36 people per week Weeks 1–4: Weeks4–6: = –14people per week =–33people per week Weeks 6–10:
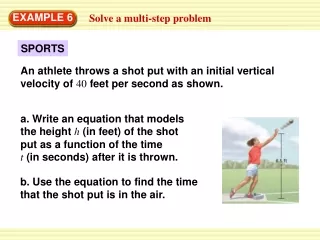
COMMUTING TO SCHOOL A student commutes from home to school by walking and by riding a bus. Describe the student’s commute in words. EXAMPLE 7 Interpret a graph
EXAMPLE 7 Interpret a graph SOLUTION The first segment of the graph is not very steep, so the student is not traveling very far with respect to time. The student must be walking. The second segment has a zero slope, so the student must not be moving. He or she is waiting for the bus. The last segment is steep, so the student is traveling far with respect to time. The student must be riding the bus.
ANSWER Sample answer: The attendance did not decrease as rapidly between weeks 10 and 12. 8. WHAT IF?How would the answer to Example 6 change if you knew that attendance was 70 people in week 12? EXAMPLE 7 for Examples 6 and 7 Interpret a graph GUIDED PRACTICE
9. WHAT IF?Using the graph in Example 7, draw a graph that represents the student’s commute from school to home. ANSWER EXAMPLE 7 for Examples 6 and 7 Interpret a graph GUIDED PRACTICE