Fair-Weather Atmospheric Electricity Dataset: ATMEL2007A
10 likes | 77 Views
This joint dataset consists of 500,798 diurnal records of atmospheric electricity and associated meteorological and air pollution measurements, with a total of 64 quantities considered, recorded at 12 stations. The data can be processed with the DD data manager, enabling various tasks like importing, exporting, and data manipulation. The dataset is proposed for research on atmospheric electricity correlations, air pollution effects, and global climate trends. Free software and user manual available for download at the provided link.

Fair-Weather Atmospheric Electricity Dataset: ATMEL2007A
E N D
Presentation Transcript
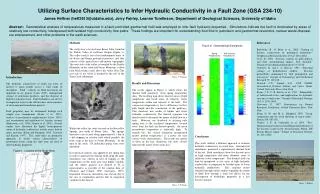
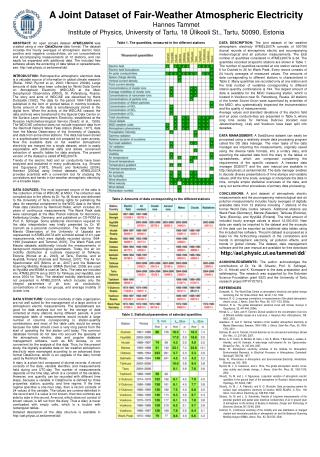
DATA DESCRIPTION: The joint dataset of fair weather atmospheric electricity ATMEL2007A consists of 500798 diurnal records of atmospheric electric and accompanying meteorological and air pollution measurements. The total number of quantities considered in ATMEL2007A is 64. The quantities recorded at specific stations are shown in Table 1. The number of quantities recorded at one station varies from 6 for Dusheti to 26 for Wank Peak. Every record consists of 24 hourly averages of measured values. The amounts of data corresponding to different stations is characterized in Table 2. Many quantities are recorded only at one station and the total number of variables corresponding to different station-quantity combinations is 194. The largest amount of data is available for the MGO measuring station, which is located in Voeikovo near St. Petersburg, Russia. All stations of the former Soviet Union were supervised by scientists of the MGO, who systematically inspected the instrumentation and the quality of measurements. Average values and standard deviations of the electric field and air polar conductivities are presented in Table 3, where long time series for Verhnee Dubrovo (located near Jekaterinenburg, Ural) and Voeikovo have been split into decades. DATA MANAGEMENT: A DataDiurna dataset can easily be processed using a relatively simple data processing program called the DD data manager. The main tasks of the data manager are importing the measurements, originally saved using the diverse table formats, into a unitary diary, and exporting the selected data from the diary to the tables or spreadsheets, which are composed considering the requirements of the specific research. A freeware data manager DD2007T and the user manual are available in http://ael.physic.ut.ee/tammet/dd. The data manager enables to decode diverse presentations of time stamps and variable values, shift the time scale, average or interpolate the data in time, compile simple statistical overviews of the data, and carry out some other procedures of primary data processing. CONCLUSIONS: A joint dataset of atmospheric electric measurements and the accompanying meteorological and air pollution measurements includes hourly averages of digitally available data from 12 stations including 7 stations of the former World Data Centre network. Additional stations are Wank Peak (Germany), Marsta (Sweden), Tahkuse (Estonia), Tartu (Estonia), and Hyytiälä (Finland). The total amount of included hourly average values is about 12,000,000. New data can easily be imported to the dataset and the excerpts of the data can be exported as traditional data tables using the included free software. The joint dataset is proposed as a basis for the forthcoming research of the correlations and trends in atmospheric electricity, air pollution effects, and trends in global climate. The dataset, data management software and the user manual are available for free download: http://ael.physic.ut.ee/tammet/dd/ ACKNOWLEDGEMENTS: The author acknowledges the contributions of Dr. Ya. M. Shvartz, Prof. K. Schlegel, Dr. U. Hõrrak and K. Komsaare to the data preparation and safekeeping. The research was supported by the Estonian Science Foundation grant 6223 and the University of Tartu research project PP1FY07913. Table 1. The quantities, measured in the different stations A Joint Dataset of Fair-Weather Atmospheric ElectricityHannes TammetInstitute of Physics, University of Tartu, 18 Ülikooli St., Tartu, 50090, Estonia Table 2. Amounts of data corresponding to the different stations ABSTRACT: An open access dataset ATMEL2007Awas created using a new DataDiurna data format. The dataset includes the hourly averages of atmospheric electric field, positive and negative conductivities, air ion concentrations and accompanying measurements at 12 stations, and can easily be expanded with additional data. The included free software allows the extracting of data tables or spreadsheets, see: http://ael.physic.ut.ee/tammet/dd/. INTRODUCTION: Retrospective atmospheric electrical data is a valuable source of information in global climate research [Reiter, 1992; Rycroft et al., 2000; Harrison, 2004b]. Large amounts of data have been collected by World Data Centre on Atmospheric Electricity (WDC/AE) at the Main Geophysical Observatory (MGO), St. Petersburg, Russia. The story and aims of WDC/AE are described by Hans Dolezalek [1992]. The data for the period 1964-1989 were published in the form of printed tables in monthly booklets. Some amount of the data is simultaneously stored in the digital form. When the activity of the WDC/AE ceased, the data archives were transferred to the Special Data Center on the Surface Layer Atmospheric Electricity, established at the Russian Hydrometeorological Service [Svartz et al., 1999]. The WDC/AE collection does not include important data from the Reinhold Reiter's Wank Peak station [Reiter, 1977], data from the Marsta Observatory of the University of Uppsala, and data from some other stations. The data has been stored in a sophisticated format and not prepared for open access. Now the available data on fair weather atmospheric electricity are merged into a single dataset, which is easily expandable with additional data and allows convenient extraction of specific tables for data analysis. The present version of the dataset is called ATMEL2007A. Trends of the electric field and air conductivity have been analyzed and explained in many publications, e.g. Shvartz and Oguryaeva [1987], Shvartz and Sokolenko [2004], Harrison [2004a] using limited datasets. ATMEL2007A provides scientists with a convenient tool for studying the correlations and trends in fair-weather atmospheric electricity on a broader basis. DATA SOURCES: The most important source of the data is the collection of files of WDC/AE at MGO. The collection was compiled due to the efforts by Dr. Ya. M. Svartz and delivered to the University of Tartu, including rights for publishing the data. An essential complement to the WDC data is the Wank Peak data collection by Reinhold Reiter, which includes 9½ years of continuous measurements. The Wank Peak data were rearranged at the Max Planck Institute for Aeronomy, Katlenburg-Lindau, Germany, and published on CD-ROM by Prof. K. Schlegel. Some additional information required for the data interpretation was kindly presented by Dr. W. Carnuth as a personal communication. The data from the Marsta Observatory of the University of Uppsala are represented in ATMEL2007A with a limited subset of 4½ year measurements, which were digitally recorded during 1994-1998 [Israelsson and Tammet, 2001]. The Wank Peak and Marsta datasets additionally include the measurements of background meteorological parameters. Today, the air ion mobility distribution is routinely measured at Tahkuse, Estonia [Hõrrak et al., 2003], at Tartu, Estonia, and at Hyytiälä, Finland [Kulmala and Tammet, 2007]. The Air Ion Spectrometer AIS [Mirme et al., 2007] and the Balanced Scanning Mobility Analyzer BSMA [Tammet, 2006] are used at Hyytiälä and BSMA is used at Tartu. The data are included into ATMEL2007A since 2003 for Tahkuse and Hyytiälä, and since 2004 for Tartu. The detailed mobility distributions are not presented in ATMEL2007A, which includes only the integral parameters of air ions: air conductivity, concentrations of wide ion groups, and average mobility of cluster ions. DATA STRUCTURE: Common methods of data organization are not well suited for the management of a large archive of atmospheric electric measurements. The spreadsheets are good for data analysis but not for the storage of data collected at many stations during different periods. A joint rectangular table of measurements would include a large number of columns corresponding to station-quantity combinations and most of the table cells would be empty because the table should cover a very long period from the start of operating the first station until today. The common database formats do not take into account the specialty of the atmospheric electric data and popular database management software, such as MS Access, is not convenient for the analysis of this data. Thus, for the present study, the digitally available data on fair weather atmospheric electricity were rearranged according to an advanced diary format DataDiurna, which is an upgrade of the diary format used by Reinhold Reiter. A diary is a plain text composed of diurnal records. A record consists of the date, variable identifier, and measurements held during one UTC-day. The number of measurements depends on the time step, which is a constant of the variable. However, one quantity can be recorded with different time steps, because a variable in DataDiurna is defined by three properties: station, quantity, and time regime. If the time regime specifies a one-hour step, then a record consists of 24 values of the variable. The values are comma-delimited in the record and if a value is not known, then two commas are side by side in the record. A record, which does not consist of known values, is left out from the diary. Thus a diary is never overloaded with empty cells, which is a trouble with rectangular tables. Detailed description of the data structure is available in http://ael.physic.ut.ee/tammet/dd/. REFERENCES Dolezalek, H., The World Data Centre on atmospheric electricity and global change monitoring, Eur. Sci. Notes Inform. Bull., 92-02, 1-32, 1992. Harrison, R. G., Long-range correlations in measurements of the global atmospheric electric circuit. J. Atmos. Solar-Terr. Phys., 66, 1127-1133, 2004a. Harrison, R. G., The global atmospheric electrical circuit and climate, Surveys in Geophysics, 25, 441-484, 2004b. Hõrrak, U., J. Salm, and H. Tammet, Diurnal variation in the concentration of air ions of different mobility classes at a rural area. J.Geophys. Res. Atmospheres, 108, 4653, 2003. Israelsson, S. and H. Tammet, Variation of fair weather atmospheric electricity at Marsta Observatory, Sweden, 1993–1998, J. Atmos. Solar-Terr. Phys., 63, 1693-1703, 2001. Kulmala, M. and H. Tammet, Finnish-Estonian air ion and aerosol workshops. Boreal Env. Res., 12, 237-245, 2007. Mirme, A., E. Tamm, G. Mordas, M. Vana, J. Uin, S. Mirme, T. Bernotas, L. Laakso, A. Hirsikko, and M. Kulmala, A wide-range multi-channel Air Ion Spectrometer. Boreal Env. Res., 12, 247-264, 2007. Reiter, R., Atmospheric electricity activities of the Institute for Atmospheric Environmental Research, in Electrical Processes in Atmospheres, Darmstadt: Steinkopff, 759-796, 1977. Reiter, R., Phenomena in Atmospheric and Environmental Electricity, Amsterdam: Elsevier, pp. 542, 1992. Rycroft, M. J., S. Israelsson, and C. Price, The global atmospheric electric circuit, solar activity and climate change, J. Atmos. Solar-Terr. Phys, 62, 1563-1576, 2000. Shvartz, Ya. M. and L. V. Oguryaeva, Long-term variation of atmospheric electric quantities in the ground layer of the atmosphere (in Russian), Meteorology and Hydrology, N7, 59-64, 1987. Shvartz, Ya. M., I. A. Petrenko, and G. G. Shchukin, Data processing system for surface layer atmospheric electricity A.I.Voeikov MGO RCARS, in Proc. 11th Intern. Conf. Atmos. Electricity, pp. 536-539, 1999. Shvartz, Ya. M. and L. G. Sokolenko, Results of long-term measurements of the potential gradient and partial polar electrical conductivities of air in ground layer of atmosphere on the territory of Russia (in Russian), Design and Technology of Electronic Devices, N7, 55-60, 2004. Tammet, H., Continuous scanning of the mobility and size distribution of charged clusters and nanometer particles in atmospheric air and the Balanced Scanning Mobility Analyzer BSMA, Atmos. Res., 82, 523-535, 2006. Table 3. Statistical parameters of selected quantities