Download
1 / 59
590 likes | 698 Views
Transportation Centerlines: Case Studies from California and Iowa. Val Noronha University of California, Santa Barbara. Environment. Infrastructure. Flows. Hazards. . . . . 4 universities 4 TAPs. Structure. U.S. DOT — NASA Partnership Transportation Legislation “TEA-21”.

E N D
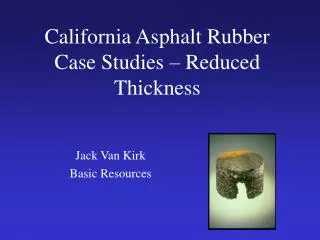
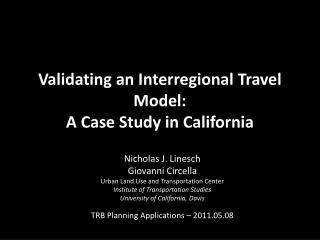
Transportation Centerlines: Case Studies from California and Iowa Val Noronha University of California, Santa Barbara
Environment Infrastructure Flows Hazards 4 universities 4 TAPs Structure U.S. DOT — NASA Partnership Transportation Legislation “TEA-21”
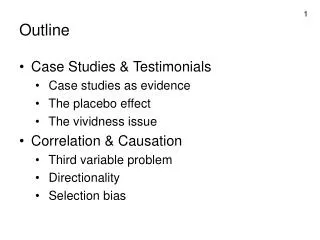
Outline • What is a centerline? • Applications, requirements, status • Survey Methods • Remote sensing: eyeball, analytical • GPS: high-end, low-end • Photogrammetry • Tomorrow’s precision standards
The Grapevine Northbound and southbound carriageways of I-5 switch places for 6 km along the San Andreas Fault
Centerline Applications Who’s paying?
TIGER USGS 1:24K Design CAD GDT Navtech State, local State, local DOT Mapquest ITS Engineering CVO/Logistics Centerline databases — families RS RS RS Producers Users
Facets of centerline data • Existence: omission/commission • Geometric accuracy (2-D) • Linear accuracy • Attributes • name and address range, speed limit • lane width, shoulder width … • Topology • Data model
Solutions—Geometry • Remote sensing • GPS • high-end dedicated • multiple vehicles? • Photogrammetry • Mosaic engineering drawings
R E M O T E S E N S I N G
Hyperspectral process 1 MESMA (Dar) Q-tree Vectorize Additional steps: clean, conflate
Hyperspectral process 2 MESMA (Dar) Thinning, Filters Comparison Additional steps: clean, conflate
T H E G P S C H A L L E N G E
High end (“SOP”) GPS • ARAN • Output: GPS every 10 m — not topological centerlines • Cost: x 104 (service) Roadware Inc
Problems w/ Dedicated GPS • Need to get it right the first time • Verification? • IMU helps ($$$)
The one to beat … • Convenience • Price $150 at Staples
? T H E G R E A T G P S - L I N E A R COMPATIBILITY C H A L L E N G E
LX for professionals • DMI: accurate to 1 m • Linear referencing: “US101 — 20.25”
A 7075 C 7472 E 7330 DMI 7477 GPS 7446
A Myth about Linear vs 2D • Distance over the hill is greater: need to correct for elevation Difference = 0.25% (on a 7% grade)
What Really Happens on the Hill Inaccurate (x,y) geometry shortchanges length up to 20%
Linear Accuracy Tests — Setting • ~10 km road, rises 800m, average 8% grade • Numerous hairpins • Some dense tree canopy and partial GPS occlusion • Remote sensing would have difficulty with this
Linear Accuracy Test — Results • $150-GPS length close to DMI • uphill: 1 ~ 1.5% • downhill: 0.5% • Uphill/downhill difference • Simulated: opposing lane geometry: 0.02-0.05% • GPS: 0.2% (higher downhill speed?) • DMI: 1.5% (affected by engine rev?) • Conclusion (provisional, more study needed) • GPS just as accurate (±0.5%), more consistent