Download
1 / 47
470 likes | 609 Views
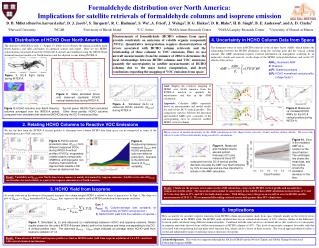
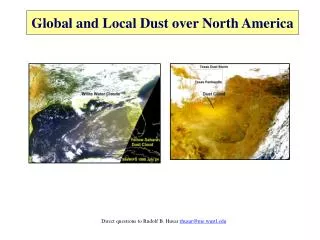
Global and Local Dust over North America. Direct questions to Rudolf B. Husar rhusar@me.wustl.edu. Aerosol Types: ‘Dust’, ‘Smoke’ and ‘Haze’.

E N D
Global and Local Dust over North America Direct questions to Rudolf B. Husar rhusar@me.wustl.edu
Aerosol Types: ‘Dust’, ‘Smoke’ and ‘Haze’ • Aerosol are composed of multiple types including urban-industrial sulfates, nitrates and organics (industrial haze), biomass smoke and windblown dust. • Each type may be considered a different pollutant since it has its own class of sources, aerosol properties and associated with different effects. • In this sense dust, smoke and haze are aerosol equivalents of the gaseous pollutants, SO2, NOx and CO but under the current regulations they are lumped under PM2.5 and PM10. • This section focuses on the dust portion of the North American aerosol.
Objectives and Approach to the Study Background • There is considerable research literature on the dust aerosol pattern and characteristics over North America. • However, both the recent satellite and previous research on North American Dust is fragmented, and uneven in spatial, temporal an compositional coverage. • An integrated assessment of the North American dust using the rich literature and the most recent data would be most desirable. Objectives • Establish the spatio-temporal and chemical pattern of the airborne dust over North America • Characterize the features of dust from the different sources • Attribute the dust over NAM to the major source regions Approach • Integrate data from surface and satellite observations • Combine spatial, temporal and compositional analysis • Invite the community to actively particulate in conducting this open, integrative analysis Status (May 2001) • Recent data from several satellite and surface sensors were analyzed and presented graphically • The data and knowledge from the literature has not yet been incorporated • An open discussion and interaction with the community is to begin in June 2001
Applications of the Study NARSTO-PM Assessment. NARSTO is conducting a PM Assessment for North America. This work supports the NARSTO PM Assessment process. Monitoring Network Design/Evaluation. EPA is implementing an extensive monitoring network for speciated PM sampling. This work supports the design and performance-evaluation of the new network. MODELS-3 Evaluation. EPA’s MODELS-3/CMAQis a sophisticated high resolution, regional-scale modeling system designed to simulate and investigate gaseous and fine pattern over the US. This work supports the evaluation and further development of the model. Regional Haze Management. In response to the new haze regulations, Regional Planning Organizations (RPOs, Central States, Northeast OTC, Western States ) have been set up for haze management. This work is to provide background information to be used by the RPOs.
Dust Physical, Chemical and Optical Properties • Physical - size distribution and shape • Determines the atmospheric residence time, optical properties • Chemical – elemental and molecular composition • Influences optical properties, fertilizing and other effects • Serves as source fingerprint • Optical – refractive index • Influences effects on visibility and climate • Allows detection by remote sensing
Dust Particle Size and Shape • Dust particles are irregularly shaped crystals • Virtually all the dust mass is over 1 mm in size • The mass mean diameter (MMD) of dust near the source is over 5-10 mm • However, long range transported dust (3-10 days old) has MMD of 2-5 mm • Hence local dust is virtually all in the coarse mode (>2.5 mm) while long-range dust has 30-50% of the mass in the PM2.5 range.
Residence Time in the Atmosphere (Jaenicke) 1 mm ~ 15 days 10 mm ~ 1 day 100 mm ~ 15 min Atmospheric Residence Time of Dust PM2.5 Residence Time Increase with Height • Coarse dust particles with 10 and and 100 mm size, settle out within 1 day and 15 minutes, respectively. • Fine dust particles are removed by clouds and rain • Within the atmospheric boundary layer (the lowest 1-2 km), the residence time is 3-5 days. • Aerosols lifted to 3-10 km (e.g. by deep convection, convergence) reside in the atmosphere for transported for weeks and many thousand miles before removal.
The Characteristic Dust Size: Inferred from PM2.5/PM10 Ratio • If most of the total aerosol mass (90+%) is due to dust, the PM2.5/PM10 ratio is indicative of the characteristic size. • In then Virgin Islands during the high concentration dust events, the PM2.5 accounts for 38% of the Pm10 mass. • In Washington State during the April 1998 Asian Dust Event, the PM2.5/PM10 ration was 0.38. • Assuming a log-normal dust size distribution, these ratios correspond to a mass median diameter of about 3-4 mm • This is consistent with a variety of literature sources: the well aged (~5-10 days) Sahara and Asian dust is in the characteristic 3-4 mm size range.
Chemical Properties • To be reviewed (concisely) from the literature
Chemical Characteristics of Asian & Saharan Dust Average Elemental Rations • Comparison of dust elemental composition at Denali NP, AK (Asian dust) and at Virgin Islands NP. (Sahara dust). • Major differences exist in Al/Si (Sahara- 0.66; Asian – 0.4) and in K/Si (Sahara- 0.15; Asian – 0.08). • Potassium (at Denali and other locations) is also contributed by other sources, most notably biomass smoke. Iron/Silicon Aluminum/Silicon Potass./Silicon
Chemical Differences Between Local & Sahara Dust, Big Bend • Differences exist in Al/Si (Sahara- 0.66; Big bend – 0.55) and in K/Si (Sahara- 0.15; Big Bend – 0.08). • Potassium at Big Bend is significantly influenced by biomass smoke. • For the identification of Sahara dust fraction, the Al/Si was used (Sahara Al/Si = 0.66; Local Al/Si = 0.4)
Dust Optical Properties • To be reviewed (concisely) from the literature
Dust Transport • Atmospheric residence time of dust • Transport climatology of North America • Dust transport pathways to North America
Local, Sahara and Gobi Dust over N. America • The dust over N. America originates from local sources as well as from the Sahara and Gobi Deserts • Each dust source region has distinct chemical signature in the crustal elements. • The pattern of different dust contributions varies in space as well as by season, episodicity and vertical distribution • New satellite sensors allow monitoring the spatial and temporal pattern of dust events on a daily basis.
Transport Climatology of North America • The main transport winds are zonal westerlies at mid-latitudes, zonal tropical winds and north-south excursions • The dominant geographic features of N. America are the high Cordillera and the eastern Lowlands • TheCordillera, extensive system of mountain ranges stretches from Alaska to Mexico. It is a significant obstacle to the zonal westerly and to the easterly trade winds. ( Based on Bryson and Hare, 1974) • East of the mountains, the plains allow unobstructed path to great meridional excursions: air sweeps southward from the Arctic and northward from the tropics. • Cold and dry Arctic air, traveling always near the surface, may reach central Mexico in a few days, arriving there much colder than the normal tropical air. • Warm and moist tropical air masses penetrate northward to S. Canada, generally rising over the cooler Arctic or Pacific air layers.
Transport Pathways to North America • Low level westerly winds impinging on the Cordillera barrier are mostly deflected, some pass through to the Plains. • At about 500 N the low-level westerly zonal flow divides into northerly and southerly branches along the western slopes. • There are three main routes for the low-level westerlies to cross the Cordillera; the most notable is the Columbia-Snake-Wyoming Channel. • In Mexico, the southward deflected westerlies usually do not cross the Sierras. • Over the Gulf of Mexico, the low level easterly the trade winds are usually deflected northward. • South of the Yucatan, the trade winds cross the continent and turn southward.
5. Seattle, WA January April July October Seattle, WA is affected by air masses coming mainly from the west throughout the year.
January April July October 10. Big Bend, TX There are large seasonal differences in the directions that air masses arriving in Big Bend, TX have taken. During winter and into spring, they come from the west and the northwest,while during the summer, they come mainly from the east.
Spatio-Temporal Pattern of Dust Over N. America • Annual and seasonal dust map • Seasonal pattern at specific stations
Fine Dust Concentration based on IMPROVE • Ref: Sisler & Malm • The year average Fine Dust is highest over Texas and the Gulf States (> 1 mg/m3). • In Texas and the West, Fine Dust accounts for 10-25% of the Fine Mass. • However, in the Northeast, dust account for < 5% of the Fine Mass
Lye Brook Great Smoky Mtn. Seasonal Percentiles: Method to Characterize Source Behavior • The seasonal and synoptic (daily) variation of the dust concentration can be used to identify different dust sources. • Each dust source has a unique seasonality, but the resulting concentrations are modulated by transport and removal processes. • The charts depict the magnitude of seasonal and synoptic variation as measured by the 20-80 percentile spread At Lye Brook, VT, the clean days (20 percentile) corresponds to ~4 ug/m3 throughout the year The dirty days are (80-90%-ile) have 2-5 times higher concentration than the clean days. Dirty days, 80-90% Dirty days, 80-90% ‘Clean’ days (20%) Clean days (20%) At the Smoky Mtn, the clean days in the winter are also ~4 ug/m3. However in the summer, even the ‘clean’ days have 14 ug/m3 PM2.5. The dirty days are have 2-3 times higher than the clean days through out the year.
Voyageurs Acadia Badlands Big Bend Everglades Peripheral Sites: Fine Soil Percentiles • The Fine Dust concentrations show a unique seasonality and ‘episodicity’ (80-20 percentile ratio) for each site. • At the Everglades NP, FL, the dust concentration shows a sharp peak in July (8 ug/m3) and high episodicity. • Big Band NP, TX, shows two distinct fine dust peaks (April and July) and a
UpperBuffalo Mammoth Cave Shining Rock G.Smoky Mtn. Sipsy Central EUS: Fine Soil Percentiles • Fine dust
Washington DC Brigantine Shenandoah Dolly Sods Jefferson Mid-Atlantic: Fine Soil Percentiles • Fine dust
Acadia Lye Brook New England: Fine Soil Percentiles • Fine Dust
Sahara Dust over North America • TOMS and AVHRR Sahara Dust Plume
Sahara Dust Transport to N America, July Sahara Dust Plume Based on TOMS Satellite. Work of Herman, Prospero…. Sahara Dust Plume • In July (1998) elevated levels of absorbing aerosol (Sahara Dust) reaches the Gulf of Mexico and evidently, enters the continent . • High TOMS dust levels are seen along the US-Mexican borders, reaching New Mexico. Higher levels also cover the Caribbean Islands and S. Florida. • Another patch of absorbing aerosol (local dust?) is seen over the Colorado Plateau, well separated from the Sahara dust.
Sahara Dust Transport Across the Atlantic • The transport of Sahara dust across the Atlantic to N. America has been studied systematically since the late 1800s. More recently it has been documented extensively by Prospero and co-workers • Currently, the daily pattern of global dust, smoke and sulfate is being simulated by dynamic aerosol transport models, most notably by Westphal at the Naval Research Laboratory. The NRL model indicates that the dust layer is highest over Africa and subsides as it approaches N. America. • Data from the LITE space-born lidar instrument (above) show that a large fraction of the Sahara dust travels across the Atlantic in elevated layers (up to 5km). • However, surface measurements along the dust track also show ground-level dust throughout the dust path.
Sahara and Local Dust Identification at Big Bend, TX • The two dust peeks at Big Bend have different Al/Si ratios • During the year, Al/Si = 0.4 • In July, Al/Si reaches 0.55, closer to the Al/Si of the Sahara dust (0.65-0.7) • The spring peak is identified as as ‘Local Dust’, while the July peak is dominated by Sahara dust. • If most of the Coarse Mass (PM10-PM2.5) is dust, the CM/FM ratio is indicative of the dust size. • In the winter, CM/FM ~ 20, which implies large characteristic dust size (>10 mm). The spring ratio is ~8 which corresponds to smaller size (8-10 mm?) • In July, CM/FM dips to ~ 4 • The July ratio approaches the Sahara dust ratio of CM/FM ~3.
Attribution of Fine Particle Dust: Local and Sahara • In Florida, virtually all the Fine Particle Dust appears to originate from Sahara throughout the year • At other sites over the Southeast, Sahara dominates in July • The Spring and Fall dust is evidently of local origin
Annual July Sahara and Local Dust Apportionment: Annual and July The Sahara and Local dust was apportioned based on their respective Al/Si ratios. • The maximum annual Sahara dust contribution is about 1 mg.m3 • In Florida, the local and Sahara dust contributions are about equal but at Big Bend, the Sahara contribution is < 25%. • In July the Sahara dust contributions are 4-8 mg.m3 • Throughout the Southeast, the Sahara dust exceeds the local source contributions by w wide margin (factor of 2-4)
Sahara Events over the Eastern US PM10 in Sahara Dust Events • Based on PM10 data in EPA’s AIRS. Previous work by Prospero, Cahill, Malm … • Scanning the AIRS PM10 database several regional-scale PM10 episodes over the Gulf Coast (> 80 ug/m3) • Three such episodes are shown on the right for July 5, 1992, June 30, 1993 and June 21, 1997. • Speciation data (IMPROVE) show that during the events, the fine particle dust exceeds 20 ug/m3. The Sahara dust impact on PM10 is not confined to fluke events. In fact, the regional PM10 concentrations over the entire Eastern US (90th percentile) occur in July over the Gulf Coast Hence, Sahara dust is the dominant contributor to peak PM10 levels over the Gulf Coast (and over the EUS & NW Mexico?). The Sisler & Malm analysis also shows that Fine Dust over the entire US is highest over the ‘Sahara impact region’. Issue: Can this be true????RBH
Satellite Observation of Sahara Dust (SeaWiFS) • The SeaWiFS satellite provides ‘truecolor’ images of the Sahara dust as it approaches (July 21, 1998) and covers part of the continent (July 24). • Such SeaWiFS and other satellite data allow daily dust tracking as well as climatological dust studies. • Sahara dust has also been frequently photographed over the Caribbean by the astronauts.
East Asian Dust over North America • TOMS and AVHRR East Asian Dust Plume
Seasonal and Secular Trends of Sahara Dust over the US • Daily dust levels at 6 IMPROVE sites over the SE US were averaged to indicate regional values. • Regional Sahara Dust events occur several times each summer (as shown by Prospero, Cahill, Malm….) • Seasonal pattern peaks sharply in July when the Sahara plume swings to ne North into the Caribbean. • The July average dust declines from 7 ug/m3 in S Florida to about 1 ug/m3 in Shenandoah.
Asian Dust over North America • Asian dust is generated over the Gobi desert and its surrounding. • The dust storms are most frequent in the spring season. • The Gobi dust clouds frequently traverse the Pacific and and a fraction reaches North America • Multi-year satellite data from the AVHRR sensor shows the springtime Asian aerosol plume • In the middle of the Pacific, the Equivalent Aerosol Optical Thickness (EAOT) in the plume is about 0.3 • Dust is a contributor to the EAOT plume along with biomass smoke and industrial (sulfate haze)
Global Scale Dust Transport: The April 1998 Asian Dust Event Approximate location of the April 19 dust cloud over the Pacific Ocean based on daily SeaWiFS, GMS5/GOES9/GOES10 and TOMS satellite data. Over the Pacific Ocean, the dust cloud followed the path of the springtime East-Asian aerosol plume shown by the optical thickness derived from AVHRR data. a. GOES 10 geostationary satellite image of the dust taken on the evening of April 27. The dust cloud, marked by the brighter reflectance covers the entire northwestern US and adjacent portions of Canada. A dust stream is also seen crossing the Rocky Mountains toward the east. b. Contour map of the PM10 concentration on April 29, 1998. Note the coincidence of high PM10 and satellite reflectance over Washington c. Regional average daily PM10 concentration over the West Coast. The sharp peak on April 27-30 is due to the Asian dust.
The Asian Dust Event over NAM: A Spatial Perspective • The PM2.5 dust concentration data from the IMPROVE speciated aerosol network show virtually no dust on April 25th, high values over the West Coast on April 29th and dust further inland on May 2. • Evidently, on April 25th the dust layer seen by the sun photometers was still elevated since the surface dust concentration was low. The average PM2.5 dust concentration at three IMPROVE monitoring sites over the 1988-98 period was well below 1 mg/m3 On April 29, 1998 the sites show simultaneous sharp rise to 3-11 mg/m3. It would be interesting to perform a long-term apportioning the Asian and local dust contributions over the West Coast (similar to the Sahara impact on the Southeaster US).
The Asian Dust Event over NAM: A Long-Term Perspective Evidently, the April 1998 Asian dust event caused 2-3 times higher dust concentrations then any other event during 1988-1998.
Local Dust over North America • TOMS Dust Signal over NAM
Dust Emitted over over the North America • TOMS satellite data indicate elevated Aerosol Absorbing Index over the Southwestern US • The TOMS signal is believed to be due to absorbing dust rather then absorbing smoke. • The dust signal is present East and West of the Rocky Mountains • The source of the dust in the intermountain plateau is not known. (Daily thermal mixing?) TOMS Absorbing Aerosol Index Western US Dust ‘Bowl’. • Spatially homogeneous dust concentration (Arizona-Idaho) • Temporally homogeneous pattern (summer peak, small episodicity) • Relatively low coarse dust concentration - small particle size (4-8 um?) • Dust is mixing to high elevation (visible in TOMS satellite data)
Dec Jan Feb Jun Jul Aug Seasonality of the TOMS Dust Signal • The dust signal is most pronounced in the hot summer season
IMPROVE EPA FRM Measured Annual PM10 Concentration based on FRM PM10 data in AIRS. PM10 Measured Annual PM2.5 Concentration based on the 1999-2000 FRM network. Estimated Annual PMCoarse Concentration PMCoarse = PM10 – PM2.5 Difference of the aggregated PM10 and PM2.5 Note: Sampling methods differ; estimate uncertain. The PMCoarse concentration based on the EPA FRM methods is highest (> 20 mg/m3) in the arid Southwest (California, Arizona), in Colorado/Wyoming and PM2.5 PMCoarse
Tonto Petrified F. Bandelier Hopi Point Chiricahua Colorado Plateau: Fine Soil Percentiles • Fine dust
Sequoia Guadalupe Glacier NP San Gorgonio Big Bend Peripheral Sites: Fine Soil Percentiles • Fine dust
Locally Generated Dust Clouds over N. America • Dust clouds are visible from the SeaWiFS satellite • Dust clouds emanating from Owens Lake in California
Summary of Dust Pattern over North America NOT a summary – just notes • The Sahara and Gobi dusts are quite uniform but the NAM dust sources vary in composition. • The characteristic size dust from Sahara and Gobi to NAM is 2-4 mm mmd while the local dust is much larger. Western US Dust ‘Bowl’. • Spatially homogeneous dust concentration (Arizona-Idaho) • Temporally homogeneous pattern (summer peak, small episodicity) • Relatively low coarse dust concentration - small particle size (4-8 um?) • Dust is mixing to high elevation (visible in TOMS satellite data) • So what is the source of the dust in the intermountain plateau? (Daily thermal mixing?)