Download
1 / 35
350 likes | 535 Views
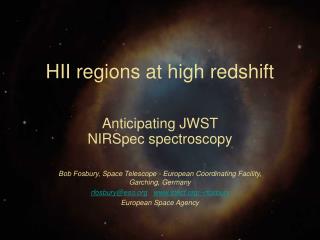
HII regions at high redshift. Anticipating JWST NIRSpec spectroscopy Bob Fosbury, Space Telescope - European Coordinating Facility, Garching, Germany rfosbury@eso.org www.stecf.org/~rfosbury European Space Agency. Example: The Lynx arc z = 3.357. Richness of UV spectrum

E N D
HII regions at high redshift Anticipating JWST NIRSpec spectroscopy Bob Fosbury, Space Telescope - European Coordinating Facility, Garching, Germany rfosbury@eso.orgwww.stecf.org/~rfosbury European Space Agency
Example: The Lynx arcz = 3.357 • Richness of UV spectrum • High colour temperature of ionizing source(s) • High ionization parameter (cf. PNe) • Nebular metal abundance ~ 10-2 Solar • Stellar abundances ??? • Huge Lyman continuum luminosity • Top-heavy IMF ? High z HII regions
Time - redshift <- µwave background comes from z~1000 LBG 3C radio galaxies Lynx arc A1835 IR1916, z = 10 Highest redshift quasar Lynx cluster Earth forms z ~ 2.5 radio galaxies Now High z HII regions
Outline • A primary scientific driver for NIRSpec is a survey of ~2500 galaxies to measure the redshifted nebular emission lines • Known as: “Kennicutt Science” • Use familiar techniques to measure SFR, reddening, element (nebular) abundances, kinematics and presence of AGN • Predicated on the use of the restframe optical spectrum ([OII] 3727 -> [SII] 6725) • Gives Ha to z ~ 6.6 and [OII] to z ~ 12.4 High z HII regions
Expectation is that many galaxies at high z will have emission line spectra representing the higher SFR at earlier epochs • This programme is severely limited from the ground • Giving Ha only to z ~ 2.8 • However, progress can be made from the ground using the restframe UV spectrum • What might we expect to measure and what can be deduced about the gas in the early universe in the presence of star formation or AGN? High z HII regions
Systematics of AGN spectra • AGN in the UV are characterised by resonance and intercombination emission lines from regions of different density • The lines result from recombination and collisional excitation processes • They tell us about • the nature of the ionization processes • the physical condition of the gas: Te and ne • the kinematics • and, to some extent, the chemical composition High z HII regions
Complexities include: • Resonance line transfer • The various effects of dust • Accounting for regions of different density and continuum opacity (radiation and matter-bounded clouds) • Photoionization codes can be used to understand the general behaviour of the nebulosities in the UV — but it is more difficult than in the optical High z HII regions
TXS0211-122 z = 2.340 High z HII regions
Quasar BLR Comparison of the kpc-scale ISM data from radio galaxies with the Quasar BLR data discussed by Hamann & Ferland High z HII regions
Spectral sequence From low-polarization, metal-poor (?) radio galaxiestoHigh-polarization, metal-rich (?) ULIRG High z HII regions
Lya/CIV & NV/CIV vs P(%) correlations High z HII regions
UV spectra of AGN and Ly-break NIV] HeII NIII] CIII] Lya SiIV OIV NV CIV OIII] SiIII] High z HII regions
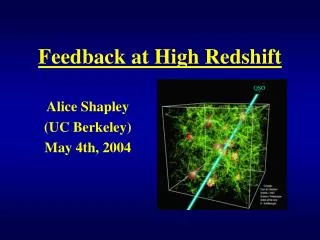
Systematics of Ly-break galaxies • See: Shapley et al. 2003, ApJ, 588, 65 • Hot stars, HII regions, dust, outflows • Relationships seen between Lya EW, continuum slope and interstellar kinematics • Likely to be determined by the nature of the outflows (covering factor and velocity) and the metallicities of the HII regions High z HII regions
Composite Ly-break spectra High z HII regions
HII regions in the UV • Local HII regions have a UV spectrum dominated by the continuum from the stellar population • Emission lines are weak since the nebular excitation is quite low — ionizing O stars are typically Teff ~ 40,000K • The presence of dust can render observations difficult • e.g., FOS spectroscopy of M101 HII regions by Rosa & Benvenuti (1994) High z HII regions
M101 HII regions High z HII regions
LHb - srelationTerlevich2 & Melnick 2002 High z HII regions
Expectations for HII galaxies at high z • Low stellar metallicities • Massive (hot) stars => high ionization nebulæ • Top-heavy IMF for 1st generation (Pop III) Low gas metallicities but get rapid pollution by Type II supernovæ The high stellar Teff means that, for a given bolometric luminosity (which is mostly below the Lyman limit) the UV/optical continuum is relatively weaker (~ T-3eff in the Rayleigh-Jeans tail) can mean that the SED longward of Lya is dominated by the 2-photon continuum High z HII regions
Models: Panagia et al. • Dependence of [OIII] on Z and Teff High z HII regions
Can we observe sources like this? • Look at the Lya emitters and distinguish between AGN and stellar-ionized nebulæ • Search for sources dominated by emission lines => characteristic loci in colour-colour diagrams • Get lucky -> the Lynx arc • Magnified sources: the ‘critical line’ searches High z HII regions
The Lynx arc, z = 3.357 • Discovered as part of the ROSAT Deep Cluster Survey (Holden et al. 2001) • Studied in detail by Fosbury et al. (2003) • Magnified by ~ x10 by two clusters at z ~ 0.5 High z HII regions
UV spectrum High z HII regions
Optical spectrum High z HII regions
SED High z HII regions
Lensing modelMarco Lombardi • Lensed by two clusters at z = 0.57 and z = 0.54 • Close to a caustic in the source plane • Total magnification between 8 and 16 • (but could be some differential effects) High z HII regions
‘Vital statistics’ • Ionizing source • TBB = 80,000 ± 10,000K • Qion = 1.6 x 1055 ph s-1 (assuming µ(A,B) = 10) • => 105–6 massive (Pop III - like) stars • Nebula • ne ≤ 1000 cm-3 (from CIII]), Te ~ 20,000K, U = 0.1 • Z/Zsun = 0.05, sgas ≈ 30 km s-1 (from CIII] and OIII]) High z HII regions
The nebular continuum (light blue line) is simply scaled from the observed Hb flux with no reddening S99 population models are for 107 Msun with a Salpeter IMF (a = 2.35; 1–100Msun) and Z/Zsun = 0.05 They produce ~ 20 x too few ionizing photons High z HII regions
Can we find these sources in the field? • Colour-redshift loci determined predominantly by the emission lines (Lynx is VERY bright at K due to [OIII]) • Will appear as Lyman forest dropouts at high z High z HII regions
GOODS CDF-S BViz High z HII regions
GOODS ACS (V1.7) #6746 • zAB = 24.43 • z = 5.6 • r ~ 1kpc • cf. Lynx • F814WAB = 23.1 • z = 3.36 • Dm(Dz)=1.32 Lya NIV] CIV High z HII regions
Conclusions The very early phase of these massive starbursts is very bright We don’t see ANY starlight directly – just the HII region glow These are efficient H-ionization engines The restrame UV spectra are a lot more interesting than those of local, metal-rich HII regions – the intercombination lines are good for abundance determinations High z HII regions
They are considerably more massive than globular clusters • We estimated ~ 109 Msun for Lynx • The ionizing stars are close to our expectation for Pop III • Are these the very early phase of collapse of the galaxies that produce the metals seen in the oldest globular cluster stars (~ -2 dex)? High z HII regions