Download
1 / 33
350 likes | 481 Views
How Has Teacher Compensation Changed?. Report Prepared for the National Conference on Teacher Compensation and Evaluation Dan Goldhaber The Urban Institute dgoldhab@ui.urban.org. Concern Over Teacher Salaries.

E N D
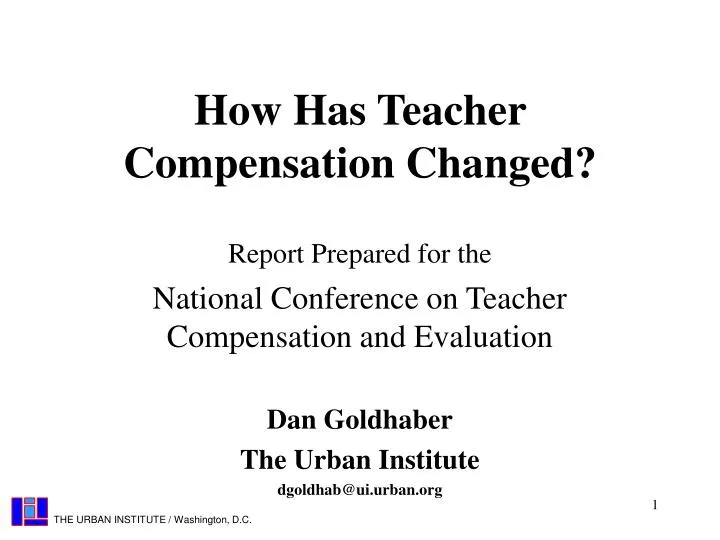
How Has Teacher Compensation Changed? Report Prepared for the National Conference on Teacher Compensation and Evaluation Dan Goldhaber The Urban Institute dgoldhab@ui.urban.org
Concern Over Teacher Salaries • “We’re beginning to see a slight improvement in salaries, but it’s a drop in the bucket compared with what needs to be done to hire sufficient numbers of talented teachers. . . When engineering, law, accounting and computer firms need high-quality employees, they’re willing to pay good salaries to attract the best and brightest. It shouldn’t be any different when it comes to educating our children.” • Sandra Feldman, AFT President
Policy Significance • Teachers matter! • Unmeasured characteristics - Goldhaber et al. (1999), Rivkin, Hanushek, and Kain (1998), Sanders (1997) • Academic Skills - Ehrenberg and Brewer (1994), Strauss and Sawyer (1986), Wayne (2001) • Ferguson (1991, 1998) • Increasing teacher test scores by 1 standard deviation raises student scores by .17 standard deviations
Teachers’ Skills • On average, teachers have • Lower standardized test scores • Require more remediation in college • Attend lower quality undergraduate institutions • “College graduates with high test scores are less likely to take jobs, employed teachers are less likely to stay, and former teachers with high test scores are less likely to return” (Murnane, et al. 1991, p. 10)
Teacher Compensation andShortage Issues • Rising enrollments • Class-size reduction policies • Tight labor market Teacher shortage • May exacerbate teacher quality problems • Assumption: compensation affects decisions • Compensation must be measured correctly to determine the incentives • Teachers should not be thought of generically
What Has Happened to Salaries? • From 1980 to 1997 teachers’ salaries increased by 120 percent, but … • Only a 19 percent increase in real terms, while salaries in other occupations increased by 29 percent • Changes in teacher demographics • Tremendous changes in working conditions
Various Measures of Change in Compensation • Average compensation (salary & benefits) • Over time • Relative to other occupations • Starting salaries • Over time • Relative to other occupations • Discussion of structure of teacher salaries relative to salaries in other occupations
Data • Bureau of Labor Statistics’ National Compensation and Employee Benefits Surveys • National Center for Education Statistics’ Baccalaureate and Beyond • U.S. Department of Education’s Digest of Education Statistics • American Federation of Teachers
Percentage of Employees Who Receive Selected Benefits
Summary: Changes in Average Salary and Benefits • Benefit coverage: • Comparable to coverage offered to other state and local employees • Exceeds that offered in the private sector as a whole • Growth in teachers’ average salaries: • Lagged other sectors in the 1970s & early 1980s, exceeded other sectors during 1980s & early1990s
Average vs Starting Salaries • Average salaries are driven by degree and experience level only • Average salary can increase w/o increases in starting salary • Shifts in degree and experience distribution can increase average salaries without making teaching a more attractive profession • Shifts in the age distribution can increase average salaries • Evidence of backloading (Lankford and Wyckoff, 1997) • Starting salaries may be more relevant to individuals considering teaching as an occupation
Minimum Average Starting Teachers' Salaries
Ratio of Starting Salaries in Select Occupations to Starting Salaries in Teaching
Starting Salaries Indexed to 1978 Teaching
Difference Between Starting Salaries in Teaching and Selected Other Occupations
Structure of Compensationin Education • Single salary schedule • 1921 was adopted in Denver, CO & Des Moines, IA • Places teachers on salary lanes based on degree and experience levels only • Today over 95 percent of school districts use this pay structure • Average salaries may not be a good indicator
You Can’t Escape the Labor Market • Hedonic wage theory applies (Chambers, 1998) • Sorting occurs along non-pecuniary lines • Graduates of more selective colleges are more likely to teach higher income, higher achieving students • Shortages in particular subject areas • Shortages vary by: • Region • Subject area • School system demographics
Math and History Teachers S Wage Wage Equilibrium math wage S Single salary schedule wage Equilibrium history wage D D employment employment Math Teachers History Teachers
Important Changes Under the Surface • Labor market differentially rewards skills • Important changes under the surface • Returns to college quality and technical college skills (degree major) have increased • There is an increasing return to graduating from a top college or university (Brewer et al., 1999) • There is an increase in the gap (in entry level salaries) between education and technical majors (Grogger and Eide, 1995) • Single salary schedule does not reflect these changes
Average Salary as a Function of SAT (Masters Degree and Above)
Starting Salary as a Function of SAT (Masters Degree and Above)
Preliminary Analyses X represents a vector of background characteristics and pub is an indicator for a public school teacher
Implications of Findings • Public schools do reward master degrees but do not reward individual SAT, college quality, or technical majors. • e.g. individuals with technical majors estimated to make $4470 more than non-technical majors outside of teaching, but about $2000 less in teaching
Alternatives to the SingleSalary Schedule • Individual-Level Merit Pay Plans • Reward teachers for individual performance • School-Based Bonuses • Reward schools for collective performance • Competency / Contingency Pay Plans • Reward individual teachers for acquiring skills • National Board Certification
Conclusion • How has teacher compensation changed? It has and it hasn’t • It’s the structure stupid! • Need for more research on the impact of alternative compensation structures on the recruitment and retention of types of teachers