Download
1 / 34
340 likes | 477 Views
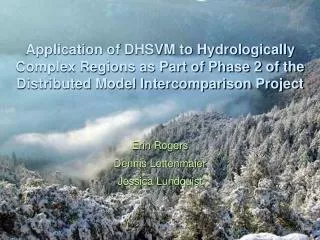
Using DHSVM to Study Land Cover Change and Temperature Change Effects on Streamflow in Puget Sound Drainage. Lan Cuo and Dennis Lettenmaier July 26 2006. Objectives land cover change effects: ~100 years ago, current and 100 years later Climate change effects (mainly T) Background

E N D
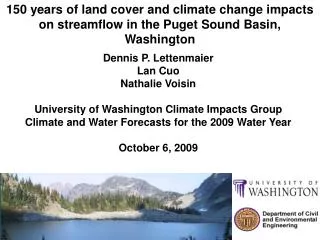
Using DHSVM to Study Land Cover Change and Temperature Change Effects on Streamflow in Puget Sound Drainage Lan Cuo and Dennis Lettenmaier July 26 2006
Objectives • land cover change effects: ~100 years ago, current and 100 years later • Climate change effects (mainly T) • Background • Methodology • Results • Problems • Future Work
Background • Study Area Puget Sound Drainage • Bounded by the Cascade and Olympic Mountains • 41,439 sqr.km • 80% land, 20% water • Temperate rainforest ecosystem • Western Hemlock, Douglas fir, Subalpine forest, and Alpine Medows • Steep slope: mollisol-ultisol-alfisol Gentle slope: Inceptisol-mollisol-spodosal Nearly level: inceptisol-mollisol-histosol http://wa.water.usgs.gov/projects/pugt/images/studymap.gif
Background • Population King county had almost 18 times more population in 2000 than 1900. Source: Washington State Office of Financial Management
Background • Upland basins Skagit Stillaguamish Snohomish Cedar Green Puyallup Nisqually Deschutes Quilcene Hammahamma Dosewallips Duckabush Skokomish Dam source: Washington State Department of Ecology
Methodology • Model Structure Interception Evapotranspiration DHSVM Components Energy and radiation balance Snow accumulation & melt Saturation excess and infiltration excess runoff Unsaturated soil water movement Ground water recharge and discharge
Methodology • Forcing Data 1-16th degree Tmin, Tmax, precipitation and wind speed grids. Used 33 stations from 1927 to 2003
Mean monthly precipitation comparison between PRISM and 1-16th grid Accumulated monthly precipitation comparison between stations, 1-8th grid and 1-16th grid over the Cedar Basin
2002 Land Cover Map in Puget Sound (Marina, 2004) Problems: 1. Clouds, no data values. 2. Incomplete in the north and south portion of Puget Sound Fixing problems: Filled no data values and clouds location with reference to CCAP 2000 land cover map. Supplement north and south portion with CCAP 2000 and GAP 1991 land cover map.
Methodology • Pilot Study Areas • Upland Cedar Basin
Methodology • Pilot Study Areas • Lowland Urban basins Spring Brook Creek Mill Creek
12113346 Gage (Spring brook creek) 12113349 Gage Location and Surround (Mill creek at mouth) 12113347 Gage (mill creek at Earthworks Park)
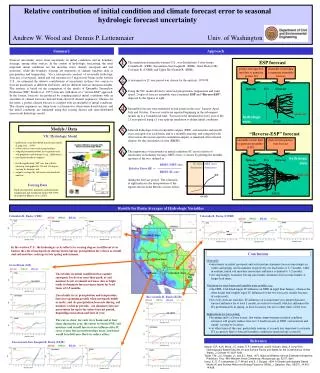
Results - Streamflow Calibration in Cedar Basin • Cedar River (1945-1985 ) Daily statistics: Observation Mean = 7.50 cms Simulation Mean = 7.50 cms Correlation Coefficient = 0.86 RMSE = 3.92 cms Model Efficiency = 0.67
B. Rex River (1945-1985) Daily statistics: Observation Mean = 2.93 cmsSimulation Mean = 2.48 cmsCorrelation Coefficient = 0.81RMSE = 2.15 cmsModel Efficiency = 0.23
C. Taylor Creek (1956-1985) Daily Statistics: Observation Mean = 2.80 cmsSimulation Mean = 2.78 cmsCorrelation Coefficient = 0.87RMSE = 1.18 cmsModel Efficiency = 0.73
Results – Streamflow Validation period : 1985-2003 • Cedar River • Daily statistics: • Observation Mean = 6.87 cms • Simulation Mean = 6.97 cms • Correlation Coefficient = 0.84 • RMSE = 4.54 cms • Model Efficiency = 0.60
B. Rex River Daily Statistics: Observation Mean = 2.69 cmsSimulation Mean = 2.29 cmsCorrelation Coefficient = 0.78RMSE = 2.42 cmsModel Efficiency = 0.15
C. Taylor Creek Daily Statistics: Observation Mean = 2.63 cmsSimulation Mean = 2.65 cmsCorrelation Coefficient = 0.85RMSE = 1.40 cmsModel Efficiency = 0.65
Urban Basin Streamflow Simulation Simulation Period: 1995-10-1 to 2003-9-30. Time step: 1 hour Mill Creek at Earthworks Park, area 2.49 sq.mile (6.4 sq.km)
Urban Basin Streamflow Simulation Mill Creek Basin area 5.63 sq.mile (14.6 sq.km)
Urban Basin Streamflow Simulation Spring brook creek basin 8.44 sq.mile (21.9 sq.km)
Green River Basin Simulation Daily Statistics: Observation Mean = 10.85 cmsSimulation Mean = 10.39 cmsCorrelation Coefficient = 0.84RMSE = 7.69 cmsModel Efficiency = 0.56
Map of Washington Showing Classification of Lands 1902 (USGS)
Re-construction Strategy • Geo-reference land cover maps. • Digitize land cover types ( 5 maps) • Make a composite historical map of land cover types for timber industry • Transform historical timber industry land cover types to Alberti Marina’s land cover types by using census data, DEM. Crittenden 1997; Harlow et al. 1979: Maple tree grows up to 1000 ft in B.C Canada. • Timber industry land cover types Transformed land cover types • Cut areas/ Timberless /Burned areas Light-medium urban (?) Grass/crop/shrub (?) Bareground (?) Dry ground (?) Clear-cuts (?) • 0-100,000 feet B.M. per acre Coniferous forest (?) Mixed/deciduous forest (?)
Problems • Good calibration in one basin does not guarantee good simulations in the other basins. • Critical issue for urban basin is to get correct basin area. Stream channels on topo map are need to get the outline of basin.
Future Work • Write a urban basin study report. • Search or make lowland urban basins. • Simulate streamflow in Puget Sound basins • Generate historical land cover map for DHSVM • Study current and historical land cover change effects • Study climate change (mainly Ta) effects