Download
1 / 1
10 likes | 101 Views
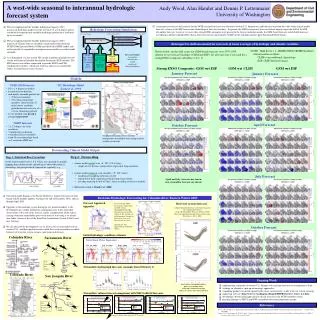
1. ESP forecast. The simulation domain,the western U.S., was divided into 5 river basins: Columbia R. (CRB), Sacramento-San Joaquin R. (SSJB), Great Basin (GB), Colorado R. (CORB) and Upper Rio Grande R. (RGB). A retrospective 21 year period was chosen for the analysis, 1979-99.

E N D
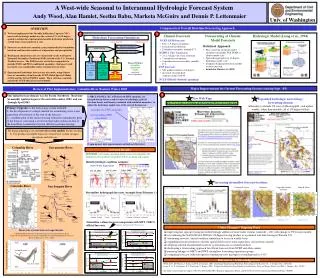
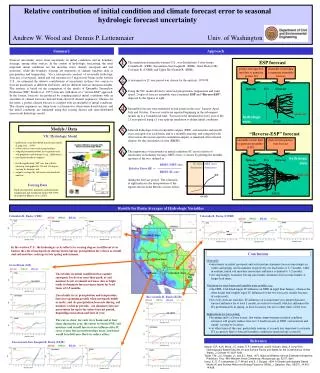
1 ESP forecast The simulation domain,the western U.S., was divided into 5 river basins: Columbia R. (CRB), Sacramento-San Joaquin R. (SSJB), Great Basin (GB), Colorado R. (CORB) and Upper Rio Grande R. (RGB). A retrospective 21 year period was chosen for the analysis, 1979-99. Using the VIC model driven by observed precipitation, temperature and wind speed, 2 types of forecast ensemble were examined, ESP and “Reverse-ESP”, depicted by the figures at right. Ensemble forecasts were initialized at four points in the year: January, April, July and October. Forecast results are reported beginning in the subsequent month, up to a 6 month lead time. Forecasts were initialized in every year of the 21 year-period, using a 1 year spin-up simulation to define initial conditions. Selected hydrologic forecast ensemble outputs (SWE, soil moisture and runoff) were averaged over each basin, and to a monthly timestep, and compared with observation-driven retrospective simulation outputs (a simulated observational dataset) for the calculation of error (RMSE). The importance of uncertainty in initial conditions (IC error) relative to uncertainty in boundary forcings (MET error), is shown by plotting the monthly quotient of the two, defined as during the forecast period. The schematic at right indicates the interpretation of the figures shown in the Results section, below. perfect retrospective met data to generate perfect ICs ensemble of met data to generate ensemble forecast 2 3 Spin-up ICs Forecast 4 observed hydrologic state RMSE 5 Models / Data “Reverse-ESP” forecast VIC Hydrologic Model ensemble of met data to generate ensemble of ICs perfect retrospective met forecast • grid-based, semi-distributed macroscale model (Liang et al.., 1994) • solves surface water and energy balance • subgrid parameterizations for vegetation and soil properties and dynamics (e.g., infiltration) • non-linear baseflow response • for this application, VIC was run at daily timestep, and applied at 1/8 and 1/4 degree, varying by domain; and • outputs averaged by sub-basin and month for analysis 6 IC error dominates MET error dominates hydrologic state Spin-up ICs Forecast RMSE (MET-ens) RMSE (IC-ens) Relative Error RE = RE observed 1 Forcing Data month Daily precipitation, minimum and maximum temperature and windspeed from 1949-1999, described in Maurer, et al. (2002) RMSE Colorado R. Basin (CORB) Columbia R. Basin (CRB) no snow Great Basin (GB) no snow Rio Grande R. Basin (RGB) no snow Sacramento-San Joaquin R. Basin (SSJB) Relative contribution of initial condition and climate forecast error to seasonal hydrologic forecast uncertainty Andrew W. Wood and Dennis P. Lettenmaier Univ. of Washington Summary Approach Forecast uncertainty arises from uncertainty in initial conditions and in boundary forcings, among other sources. In the context of hydrologic forecasting, the most important initial conditions are the moisture states (mainly snowpack and soil moisture), while the boundary forcings are timeseries of climate variables such as precipitation and temperature. Via a retrospective analysis of six-month hydrologic forecasts of snowpack, runoff and soil moisture for 5 major river basins in the western U.S., we estimated the relative contributions of uncertainty in these two sources to forecast uncertainty at different lead times, and for different forecast initiation months. The analysis is based on the comparison of the results of Ensemble Streamflow Prediction (ESP; Twedt et al., 1977) forecasts with those of a "reverse-ESP" approach. In the former, forecasts are produced by coupling perfect initial conditions with an ensemble of climate forecasts derived from observed climate sequences; whereas for the latter, a perfect climate forecast is coupled with an ensemble of initial conditions. The climate sequences are taken from a retrospective observation-based dataset, and the initial conditions are simulated using this forcing dataset and semi-distributed macroscale hydrologic model. Results for Basin Averages of Hydrologic Variables In the western U.S., the hydrologic cycle reflects (to varying degrees in different river basins) the role of snowpack in storing winter/spring precipitation for release as runoff and soil moisture recharge in late spring and summer. Conclusions • Generally: • uncertainty in initial snowpack and soil moisture dominate forecast uncertainty in winter and spring, and in summer, respectively, for lead times of 3-5 months; while in autumn, initial soil moisture uncertainty influence is limited to 1-2 months; • not surprisingly, boundary forcing uncertainty dominates forecast uncertainty at longer lead times. • Variations by river basin and variable were notable, e.g.: • the CRB, CALI had longer IC influence on SWE in April than January, whereas the other basins had roughly equal IC influence for the two forecasts, mainly because of earlier melt; • for every forecast start date, IC influence on soil moisture was greater than met. forecast influence for at least 1 month, in contrast to runoff, which is influenced by ICs predominantly in spring, in most locations, but not at other times of the year. • Implications for forecasting: • In spring and to a lesser extent, late winter, improvements in initial condition estimates will greatly reduce error in 1-5 lead forecasts of SWE, soil moisture and runoff, varying by location; • at other times of the year, particularly autumn, it is much less important to estimate ICs accurately than to forecast boundary conditions (meteorology) correctly. Uncertainty in initial conditions that capture snowpack levels at or near their peak, or soil moisture levels at annual extremes (low or high) tends to dominate forecast uncertainty for lead times of 2-5 months. Uncertainty in (a) precipitation and temperature forecasts spanning periods when snowpack builds or melts, and (b) precipitation forecasts during soil moisture recharge periods, can dominate forecast uncertainty for up to the entire forecast period, depending on location and time of year. The curves show, for each river basin and at four times during the year, the extent to which SWE, soil moisture and runoff forecasts are influenced by IC error versus forecast meteorology error, and hence would benefit from efforts to reduce either. Reference Maurer, E.P., A.W. Wood, J.C. Adam, D.P. Lettenmaier, and B. Nijssen, 2002, A Long-Term Hydrologically-Based Data Set of Land Surface Fluxes and States for the Conterminous United States, J. Climate 15, 3237-3251. Twedt, T.M., J.C. Shaake, Jr., and E.L. Peck, 1977, National Weather Service Extended Streamflow Prediction, Proc. 45th Western Snow Conference, Albuquerque, pp. 52-57, April. Liang, X., D. P. Lettenmaier, E. F. Wood, and S. J. Burges, 1994, A Simple hydrologically Based Model of Land Surface Water and Energy Fluxes for GSMs, J. Geophys. Res., 99(D7), 14,415-14,428.